Author:
Patrick Le Fèvre, Ericsson Power Modules
Date
12/29/2013
 PDF
PDF
Using Dynamic Bus Voltage (DBV) technology reduces board level energy usage at times of both high and low data-traffic demand in ICT systems. Energy savings from 3% to 10% are achievable. The European Commission DG INFSO (Directorate General – Information Society) estimates that communications network energy consumption will reach 35.8TWh in 2020, up from 21.4TWh in 2010, if ‘green network technologies’ are not adopted.
Every one percent energy saving will cut global ICT network energy consumption by 358GWh in 2020. The level of CO2 emissions per GWh will depend on the energy source, and estimates vary, but coal-fired power stations may produce up to 1000 tons of CO2 per GWh. The cost and environmental benefits of even modest improvements in ICT system energy efficiency are enormous.
Intermediate Bus Architecture (IBA)
The ICT industry adopted the Intermediate Bus Architecture (IBA) as a standard in 2003 and it now dominates in telecoms and other applications that need high availability. Intermediate Bus Converters (IBCs) convert a 48 VDC distribution-level power line to a typically static 12 VDC. The latter then feeds several non-isolated DC/DC Point-of-Load (POL) regulators, delivering 3V or below to power ICs, as shown in in Figure 1.
Click image to enlarge
Fig. 1 – Intermediate Bus Architecture with 12V bus voltage and POL regulators
To maximize system-level power conversion efficiency there needs to be an optimal balance between the intermediate bus voltage and the load currents delivered from the POLs under differing conditions. Leaving the intermediate voltage at 12V is very inefficient low traffic conditions that result in low load.
However, with advanced digital power control you can dynamically change the power envelope to meet different load conditions, adjusting the previously fixed 12 VDC intermediate bus voltage, reducing energy consumption, power dissipation, and cooling requirements.
DBV in Practice
Early attempts at DBV using analogue components proved complex and costly to implement It is only recently that advanced digital converters have been introduced that offer on-the-fly programmability. The converter commands range from simple output-voltage adjustments to complex operations such as trimming the values of the digital filter that characterizes control-loop responses. The embedded functions within the digital controller IC simplify the implementation of dynamic bus control and simple PMBus commands perform complex measurement and control functions.
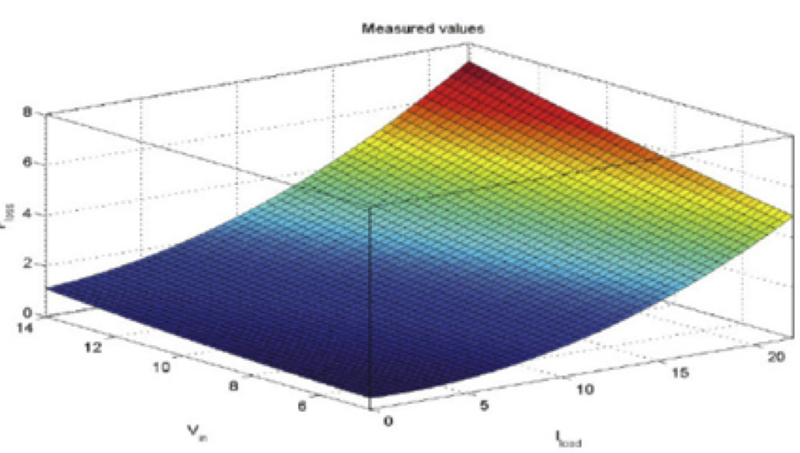
It is important to validate the potential energy savings by modeling a typical system before considering the implementation of DBV technology. Each IBC and POL in a system needs to be evaluated over at least the range of input voltages and output currents that they will experience in the end application. The power losses that result at each step are then recorded. Plotting these parameters against one another creates a three-dimensional graphical overview of each device’s performance over the chosen measurement area, as shown in Figure 2.
Click image to enlarge
Fig. 2 – Graphing power losses resulting from setting a digitally controlled POL to 1.0Vdc output and ramping the load from zero to 20A, while stepping the input from 4.5 to 14Vdc
The array of data points that build the graph come from the test results at each step. Evaluating the test results for each IBC and POL using the least-squares-fit approach builds a polynomial model of the corresponding device, which the Simulink environment can import and manipulate. Ericsson has built computer models of systems to explore the performance of alternative control strategies in maximizing the power savings delivered by dynamic bus voltage control, while ensuring that the system remains unconditionally stable.
The process begins by running an algorithm that derives a baseline power loss value. The first control cycle then starts, monitoring relative power loss until reaching a threshold value that triggers an optimization sequence.
Numerous iterations are derived from the complex algorithm but ultimately it drives the intermediate bus voltage to a value that minimizes power loss for the present conditions, then the sequence closes. The cycle repeats, each time minimizing power losses within constraints that include hysteresis to ensure stable triggering conditions for the optimization sequence. At the same time it ensures that the bus voltage does not fall below the level required to maintain regulation for the load current profile (see Figure 3).
Click image to enlarge
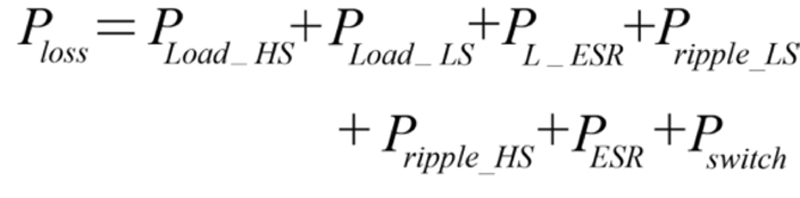
Fig. 3 – Simple theory of the power losses in a switch-mode power supply
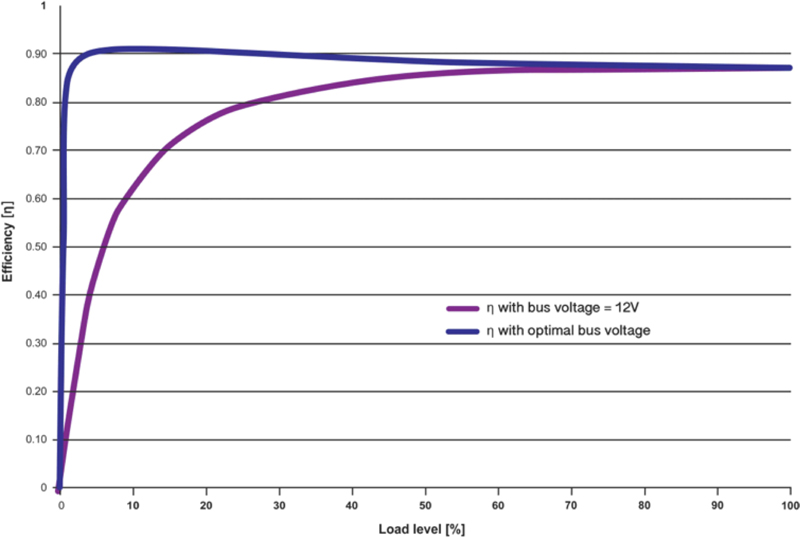
A test system comprising an Advanced Intermediate Bus Converter supplying two 20A and four 40A digital POLs illustrates the efficiency improvement potential that results from dynamically adjusting the intermediate bus level compared with a fixed 12 VDC level. Improvements are estimated at between 3 and 10%, depending on the average load per operation, as shown in Figure 4.
Click image to enlarge
Fig 4 – Improvement in board-level energy savings by adjusting bus voltage to suit the load
Simulation to Application
As data traffic levels have a profound effect on power consumption, DBV levels may be derived from traffic flow statistics. Here, controlling the bus voltage relies on lookup tables that reflect operational scenarios. The bus voltage falls as traffic levels fall and rises again with increases in traffic.
Systems architects can construct models to verify the accuracy of the profiles under consideration while they are compiling the lookup tables. They can then run a number of iterations that follow this sequence:
I. Simulate the power consumption that different load conditions create
II. Verify the simulation with hardware tests
III. Validate the simulation model or adjust it to optimize the profile
When the sequence is qualified, the profile is uploaded to the scenario library within a Board Power Manager, which controls the board’s bus voltage, among other possible tasks. Tests then run under best- and worst-case conditions before final implementation.
Operational Sequence
Each application has unique scenarios, but these are the operational sequences that apply in this case study:
• Reference Scenario
• Compare data traffic with scenario
• Validate scenario
• Adjust bus voltage to situation
• Sense data traffic and compare with traffic in the network’s neighboring cells
• Anticipate data traffic migrating from cell A to cell B
• Adjust bus voltage
• Sense and detect abnormal events
• (If Yes) Adjust bus voltage to priority High
• (If No) Adjust to local traffic scenario
• Repeat the sequence
This dynamically adjusts the intermediate bus voltage to the optimal level, while always delivering maximum power as a priority, in case of abnormal events or upon a specific user command.
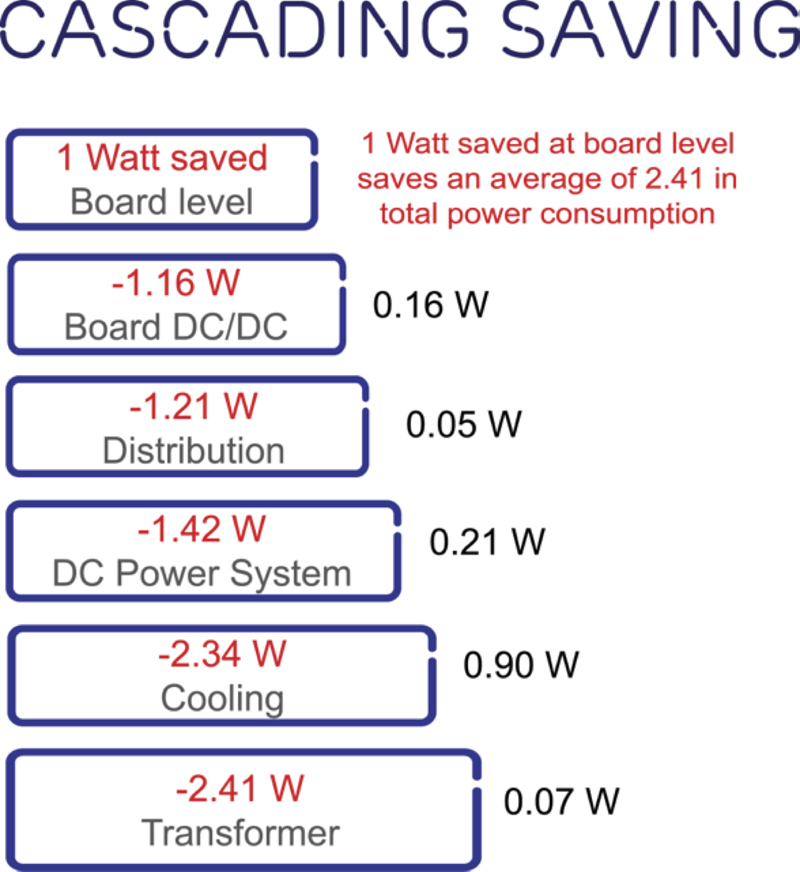
In what is known as the ‘power cascading effect’, shown in Figure 5, every Watt saved at the board level delivers an average saving of 2W to 3W at the system level. The ratio depends upon several factors but the effect has been confirmed in practice.
Click image to enlarge
Fig. 5 – Power Cascading Effect
In summary
Dynamic optimization of the voltage delivered by a master DC/DC converter to a series of POL regulators has been made possible by advanced digital power techniques. These techniques directly enable reduced power consumption. However, the ability to optimize converter performance on-the-fly and adjust the intermediate bus voltage to match load conditions are just two of the many opportunities for energy savings made possible by digital power technology.