Author:
Dr. Ray Ridley, President, Ridley Engineering
Date
05/18/2012
 PDF
PDF
In this article, Dr. Ridley provides further insight intofrequency response measurements of transformers and inductors using equipment that you probably already have in your laboratory. An improved signal generator allows errors in short-circuit measurements to be greatly reduced.
The Importance of Impedance Measurements
As mentioned in the last article in this series, impedance measurements of transformers and inductors are an essential step in producing quality magnetics for prototyping and production. Ideally, the measurements of magnetics impedance should be made with a properly calibrated and automated piece of test equipment [1]. However, many students of power electronics and engineers beginning their careers only have access to the most basic laboratory instruments. The impedances of all magnetics should still be measured with the techniques described in these articles. The time spent on this process is very valuable.
Manual Setup of Impedance Measurements
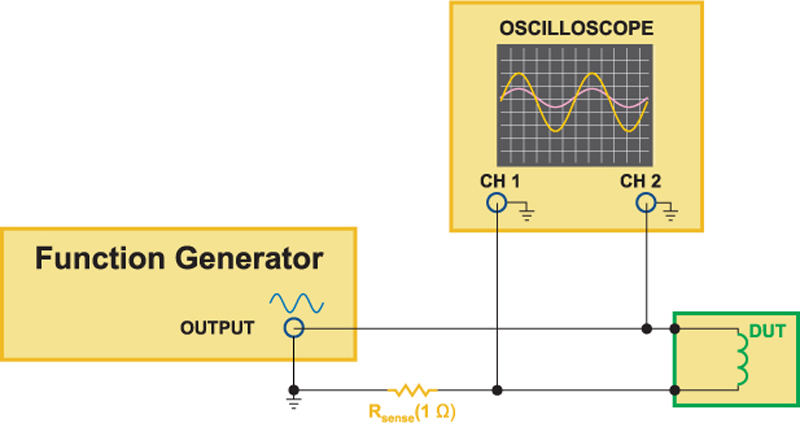
Figure 1 shows the recommended test setup for manually measuring magnetic components. The device under test is connected in series with a 1-ohm test resistor, and a signal applied across the series combination. The voltage across the 1-ohm resistor, representing the current, is measured with one channel of an oscilloscope. The voltage across the series combination is measured with the second channel.
Click image to enlarge
Fig. 1: Schematic of How to Measure Frequency Response of Magnetics Using a Signal Generator and Oscilloscope.
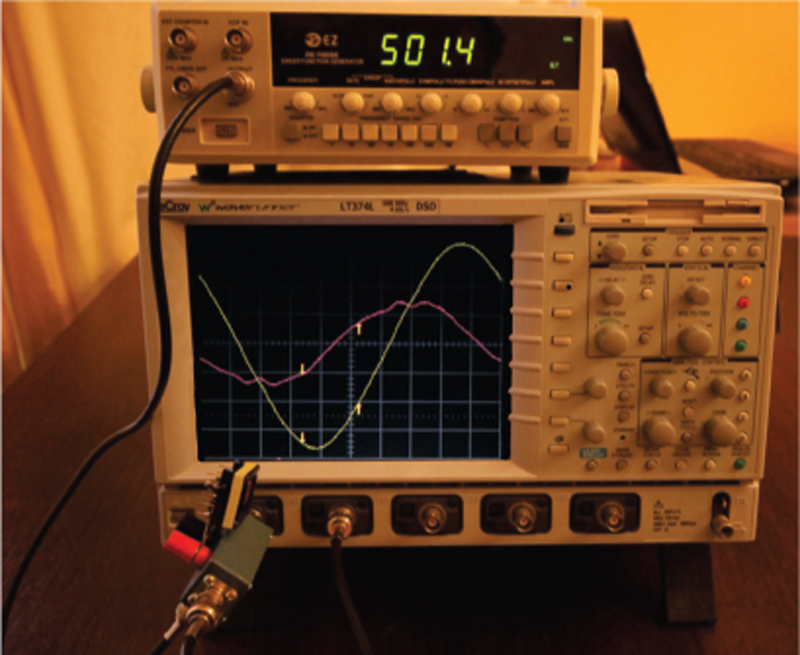
Figure 2 shows a photograph of the actual lab test setup. A small test fixture containing the sense resistor was used to improve RF layout issues of the test setup [1]. It is very important that the impedance of the sense resistor setup be accurate up to the highest measurement frequency.
Click image to enlarge
Fig. 2: Photograph of Manual Magnetics Impedance Test Setup.
This setup was used in the last article in this series. Very good results were obtained for the open-circuit measurements of a transformer. The measurements with the manual setup and with the AP300 analyzer setup were in very close agreement.
Experimental Results for Short-Circuit Impedance Measurements
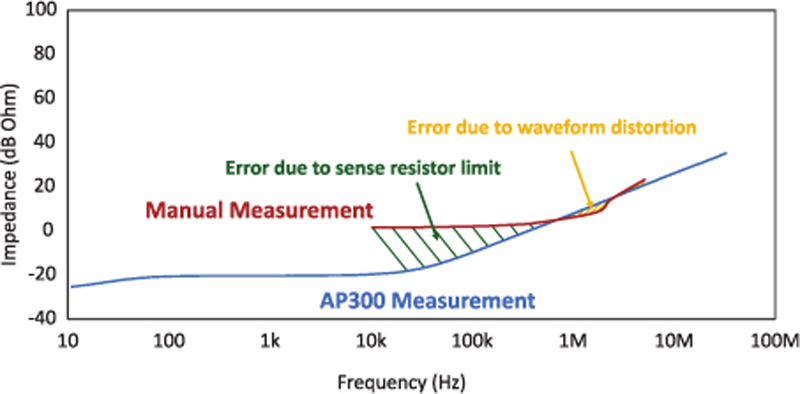
Figure 3 shows the results of measurements with the transformer secondary shorted. In this case, the manual measurements did not agree very well with the AP300 measurements.
Click image to enlarge
Fig. 3: Comparison of Manual Transformer Short-Circuit Impedance Measurements and Automated Measurements with the AP300.
There are two areas of Figure 3 where discrepancies occur. The first, shown shaded in green, is due to the measurement setup and the value of the sense resistor. The manual measurement setup cannot extract data below the 1-ohm resistor value. If measurements are made more accurately together with phase information, it is possible to extract lower impedance information, but this is very time consuming. This is easy to do with automated equipment [1].
Alternatively, the resistor size can be reduced to 0.1 ohm, but this presents problems with accuracy of the sense resistor. Errors are introduced at low frequencies due to the contact resistance in the measurement setup. At high frequencies, errors are introduced due to the parasitic inductance of the sense resistor connections. The low frequency information below 1 ohm is not typically as important in understanding the characteristics of the magnetics, so the sense resistor was kept at the 1 ohm value as a practical compromise.
Signal Generator Waveform Distortion
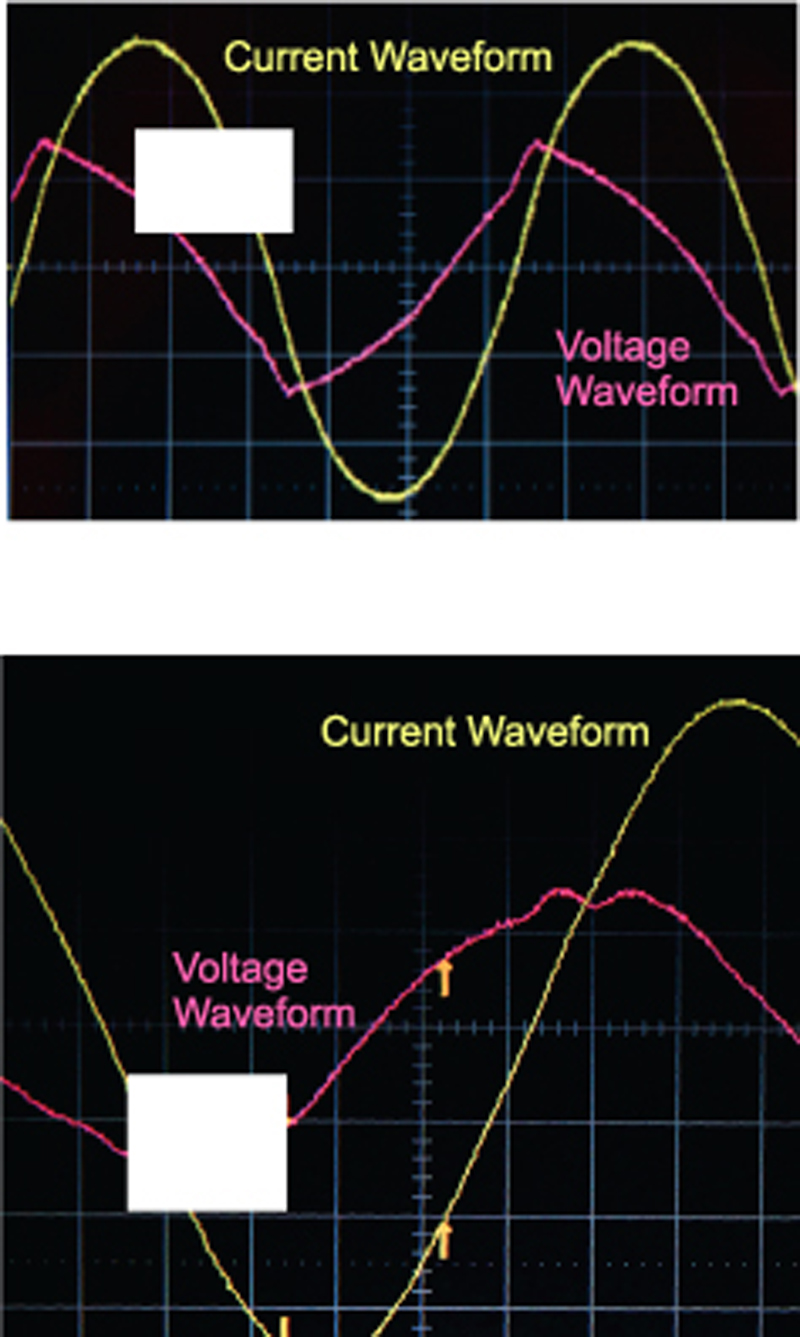
The second area of discrepancy in the short-circuit impedance measurement is shown shaded in gold in Figure 3. This was caused by distorted drive signal from the signal generator. Most signal generators are designed to produce a small-signal output with an impedance of 50 ohms. With modern low-cost test equipment, the waveforms can become very distorted as shown in the two sets of voltage and current waveforms shown in Figure 4.
Clcik image to enlarge
Fig. 4: Distorted Voltage and Current Waveforms from Signal Generator.
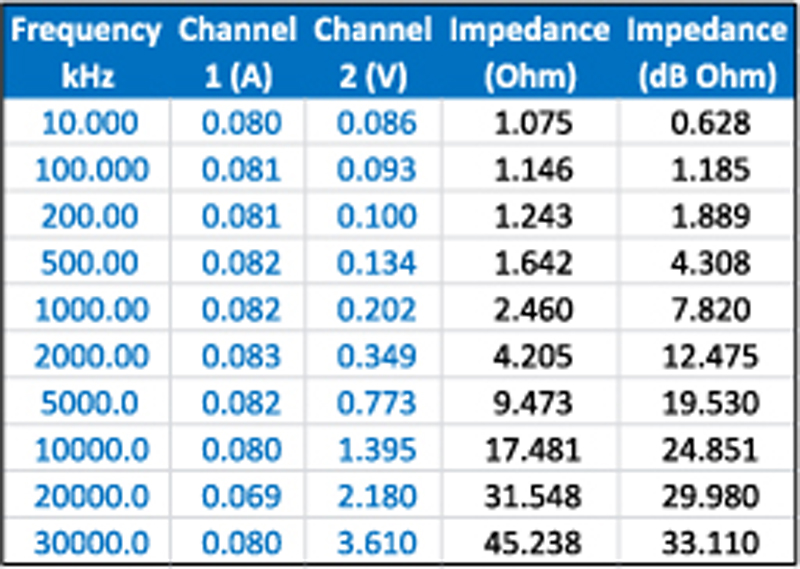
To improve the measurement results, a better signal generator is needed, or you can use a low-impedance high-quality power amplifier to drive the test setup. This experiment was done with a good signal generator and the table of results is presented in Figure 5.
Clcik image to enlarge
Fig. 5: Table of Data Collected with Manual Measurements.
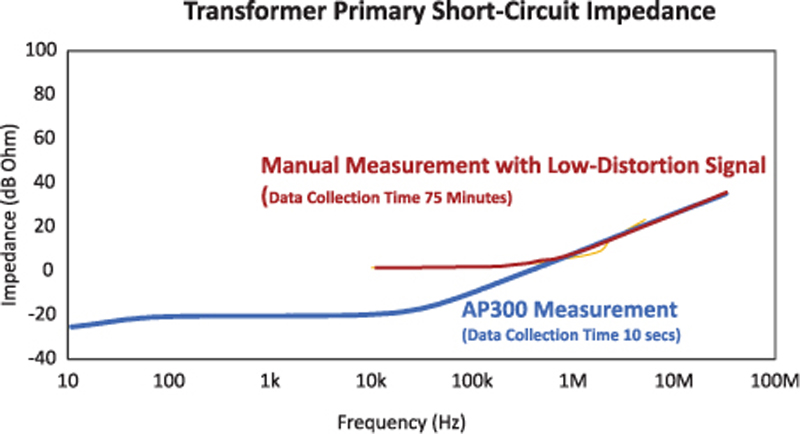
Figure 6 shows a plot of the improved results using the better-quality signal generator. It can be seen that the results are very close to those obtained with the AP300 analyzer, validating the approach of manual measurements for the more difficult task of short-circuit measurements.
Click image to enlarge
Fig. 6: Improved Short-Circuit Measurement Results with Low-Distortion Generator.
While these results are much improved, the manual measurements still consumed a considerable amount of time. Even with the better signal generator, distortion still occurred if the drive signal was set too high, and several iterations were required to obtain good quality results. The plot of Figure 6 took about 75 minutes to produce in the lab.
Summary
Magnetics impedance measurements should always be made for switching power supplies, whether you are a student, an engineer at a small company, or working for a large organization. If you have a sufficient equipment budget, then the AP300 analyzer provides the most accurate and rapid solution available. If you don�t have available budget, take time to do the measurements manually. Whichever method you choose, do not be tempted to skip this crucial step in your magnetics development.
References
1. Ridley Engineering Frequency Response Analyzer from AP Instruments, www.ridleyengineering.com/index.php/analyzer.html
2. Ridley Engineering Design Center, www.ridleyengineering.com/index.php/design-center.html