In this series of articles, Dr. Ridley discusses the four important frequency-response measurements to be made during full characterization of a switching power supply. The important relationships between loop gain and audiosusceptibility measurements are highlighted in this second article. As with output-impedance measurements, it is possible to extract a calculated loop gain from the audiosusceptibility measurements, but direct loop gain is recommended to guarantee rugged stability.
Power Supply Transfer Function Measurements
There are four fundamental transfer functions that characterize the small-signal performance of a switching power supply. They are as follows:
1. Loop gain and phase– determines the stability of your design, and available margin to accommodate variations in components.
2. Output impedance– determines the output regulation, dynamic load response, and susceptibility to complex loading.
3. Audiosusceptibility– determines the transmission of noise from input to output.
4. Input impedance– determines the sensitivity of the power system to input filter or input power system components.
The first two parameters, loop gain and output impedance, were discussed in the first article of this series. It is highly recommended that both of these measurements are made on every switching power supply that you design and build. The loop measurement is essential to guarantee stability over the lifetime of the power supply, and the output impedance gives comprehensive information about the performance in the presence of load variations.
An audiosusceptibilitymeasurement gives information about the transmission of noise from the input of the power supply through to the output. It is usually a requirement of the documentation package in the aerospace industry. This measurement is more difficult to make than output impedance since a perturbation must be injected on top of the high-power input rail. Most commercial designs omit this measurement, although it can be very useful for getting maximum performance out of your power supply. With the injection techniques recommended in this article, it is not that hard to make the measurement and it is usually well worth the time.
Audiosusceptibility Measurements
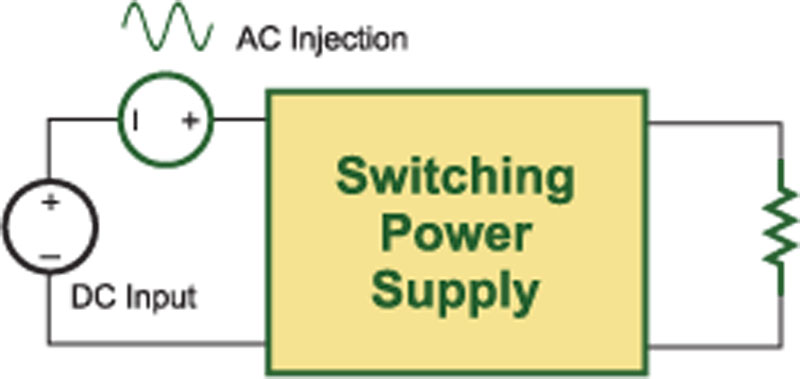
Audiosusceptibility directly shows how well a converter rejects noise appearing on the input. In order to measure audiosusceptibility, a voltage source must be injected in series with the input of the power supply as shown in Figure 1.
Click image to enlarge
Fig. 1: Audiosusceptibility is measured by adding a voltage signal at the input terminals of a power supply.
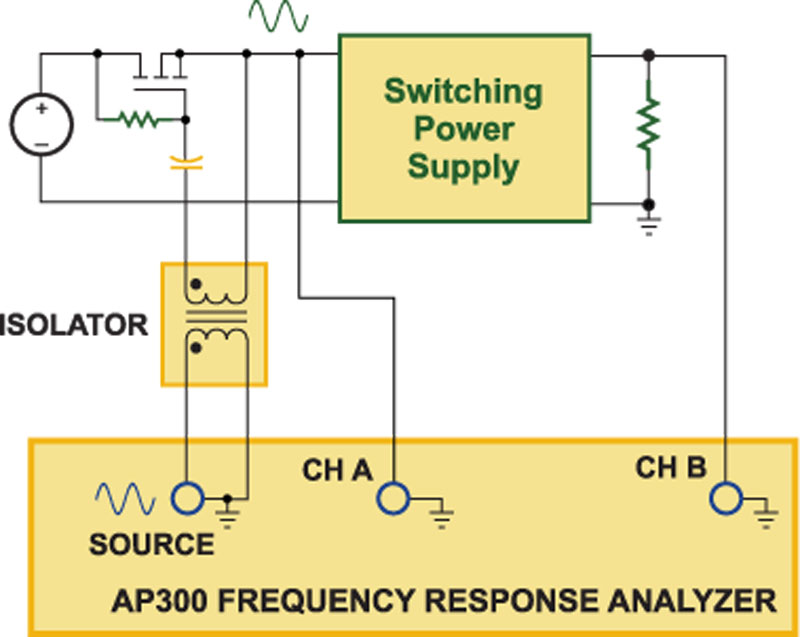
Figure 2 shows how this is implemented practically using a frequency response analyzer and a few discrete devices. The output of the analyzer is connected to wide-bandwidth isolator which is then AC coupled to a FET hooked up as a voltage follower. The size and rating of the FET may vary according to the power level and voltage level of the converter that is being driven. This injection technique is much simpler and more cost effective than inserting a high-power amplifier in series with the input source, and will allow sufficient signal to be injected for most applications.
Click image to enlarge
Fig. 2: Practical test setup for injecting voltage signal and measuring audiosusceptibility.
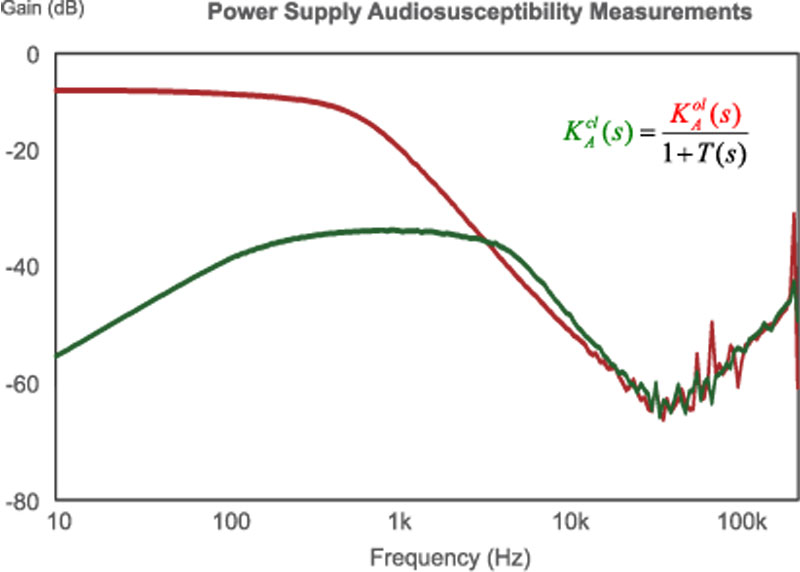
It is useful to plot both the open-loop and closed-loop audiosusceptibility to show how well your control design is implemented. These two measurements are shown in Figure 3 for a sample flyback converter operating with voltage-mode control.
Click image to enlarge
Fig. 3: Open-loop and closed-loop audiosusceptibility measurements of a flyback converter.
The green curve of Fig. 3 shows the open-loop audiosusceptibility of the converter. At low frequencies, the dc value is determined by the dc gain of the converter and the transformer turns ratio. Above 1 kHz, beyond the resonant frequency, the measured audiosuceptibility is attenuated according to the LC filter characteristics. It is often difficult to make measurements at higher frequencies due to noise pickup in the cables and the small size of the output signal, as indicated by the results of Fig.3.
The red curve of Fig. 3 shows the effect of closing the loop on the output impedance. At low frequencies, where the loop gain is high, the audiosusceptibility is greatly reduced. The two curves converge together at the crossover frequency of the loop. As is well known for a single-loop feedback system, the theoretical closed-loop audiosusceptibility is related to the open-loop audiosusceptibility by the equation:
From this equation we can see that the higher the loop gain T(s), the more the audiosusceptibility is reduced by the feedback loop. When you are designing a power supply, there are two ways to reduce the audiosusceptibility. The first is by increasing the amount of capacitance on the output of the power supply to lower the open-loop audiosusceptibility. This, of course, requires more expense in terms of parts and space. Or, you can increase the gain of the loop. Changing loop components is usually a zero-cost option, but you must be careful not to increase the loop gain too high or instability can result. Some modern converters have very low loop gains and crossover frequencies, resulting in non-optimal performance.
Loop Gain Measurements
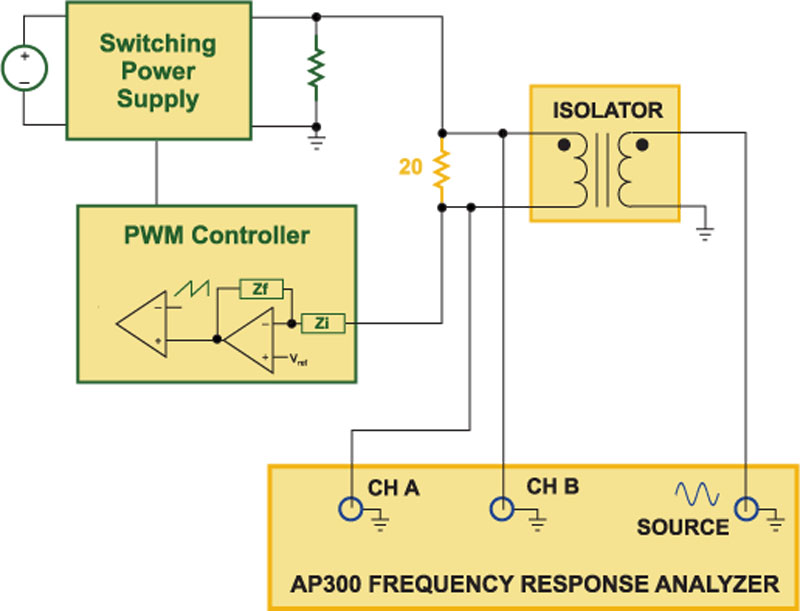
You should always measure the loop gain of your converter to ensure you are maximizing the performance in terms of audiosusceptibility and output impedance, whilst retaining rugged stability. Fig. 4 shows the test setup for injecting into the feedback loop for accurate results. This setup requires the insertion of a test resistor into the feedback loop, but this is not a difficult process. Further details of using this test setup are covered in detail in [1, 2].
Click image to enlarge
Fig. 4: Measurement technique for loop gain.
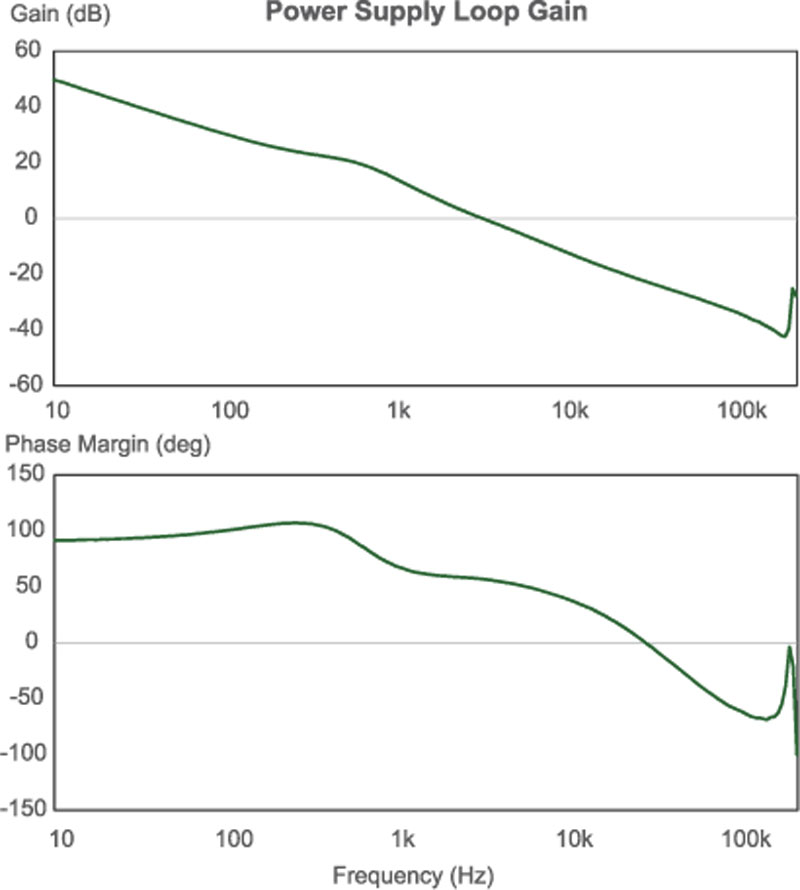
Fig. 5 shows the measured loop results for the flyback converter. The gain at 10 Hz is approximately 50 dB, and this corresponds to the difference in magnitude of the open- and closed-loop audiosusceptibility shown in Fig. 3.
The crossover frequency is at around 3 kHz, and the phase margin at crossover is 60 degrees. The open and closed-loop audiosusceptibility measurements are approximately equal at this point. It is interesting to see that beyond this frequency, the closed-loop audiosusceptibility is actually higher than the open-loop measurement. This is because the vector sum of 1+T(s) is less than one as the phase margin of the measured loop drops below 60 degrees. The same effect was observed for the output impedance measurement in the previous part of this series.
Click image to enlarge
Fig. 5: Direct loop gain measurement of flyback converter.
Synthesized Loop Gain Measurements
Three measurements have been made so far for this converter – open-loop audiosusceptibility, closed-loop audiosusceptibility, and loop gain. In theory, only two of these measurements should be necessary since the three quantities are related to each other by Eq. 1. In practice, however, we always measure all three quantities since direct measurement of each gives the most dependable results.
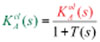
If we rearrange Eq. 1, we can express the loop gain of the converter in terms of the audiosusceptibility measurements as follows:

From this, we can try to plot the loop gain from just the audiosusceptibility measurements. Note that it is crucial that both the magnitude and phase of the audiosusceptibility measured in order to perform this calculation, even though we commonly only present the magnitude as part of a power supply characterization.
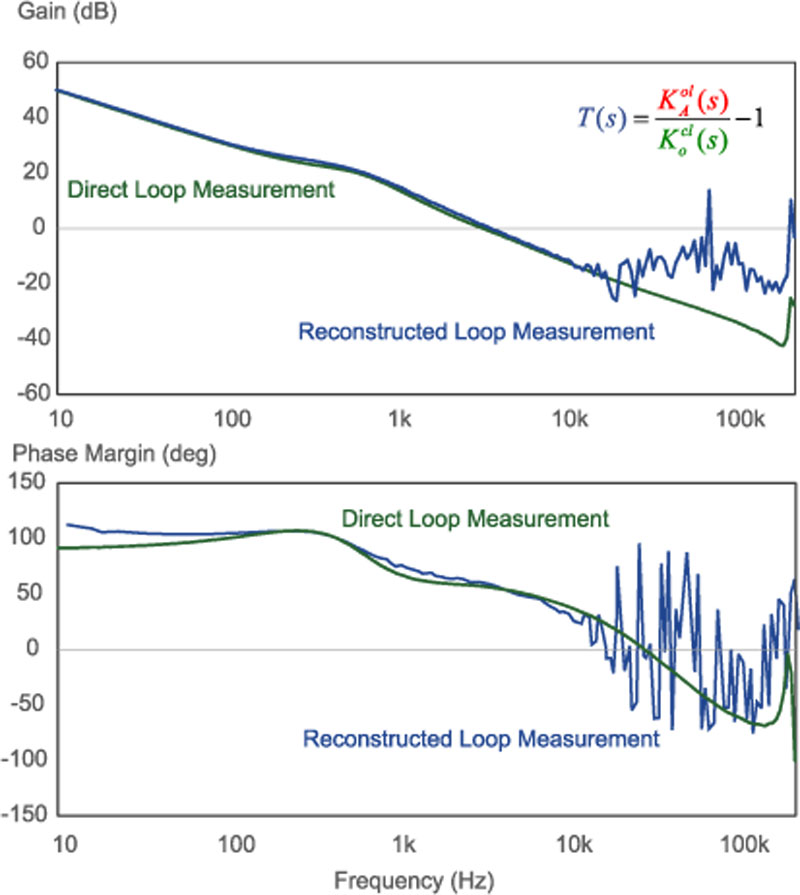
Fig. 6 shows the result of this equation plotted against the directly-measured loop. The green curve of Fig. 6 shows the directly-measured loop gain, and the blue curve shows the calculated loop gain, synthesized from the impedance measurements.
Click image to enlarge
Fig. 6: Direct loop gain measurement compared with synthesized loop from audiosusceptibility measurements.
For this power supply example, the measured and calculated loop gains agree fairly well up to the region of the crossover frequency. At high frequencies there is very significant deviation of the directly-measured true loop gain and the gain synthesized from the audiosusceptibility measurements. This is due to the noise pickup in the audiosusceptibility measurements as the attenuation is large. The synthesized loop gain of Fig. 6 is not sufficient to guarantee lifetime stability since gain margin is not measurable, and the possibility of multiple crossings cannot be observed.
Summary
This article clearly shows the relationship between loop gain and audiosusceptibility measurements. Most aerospace designs require the audiosusceptibility measurement to be made, but it is also useful for other applications, and it is recommended that you record these measurements as part of a complete documentation package.
In the next article of this series, we will look at the input impedance measurement and its correlation to loop gain.
References
1. Ridley Engineering Frequency Response Analyzer from AP Instruments, www.ridleyengineering.com/index.php/analyzer.html