Conducted Emissions Testing for Switch Mode Power Supply Designs
Switch Mode Power Supply (SMPS) technology has enabled a high level of efficiency of power conversion for electronic devices
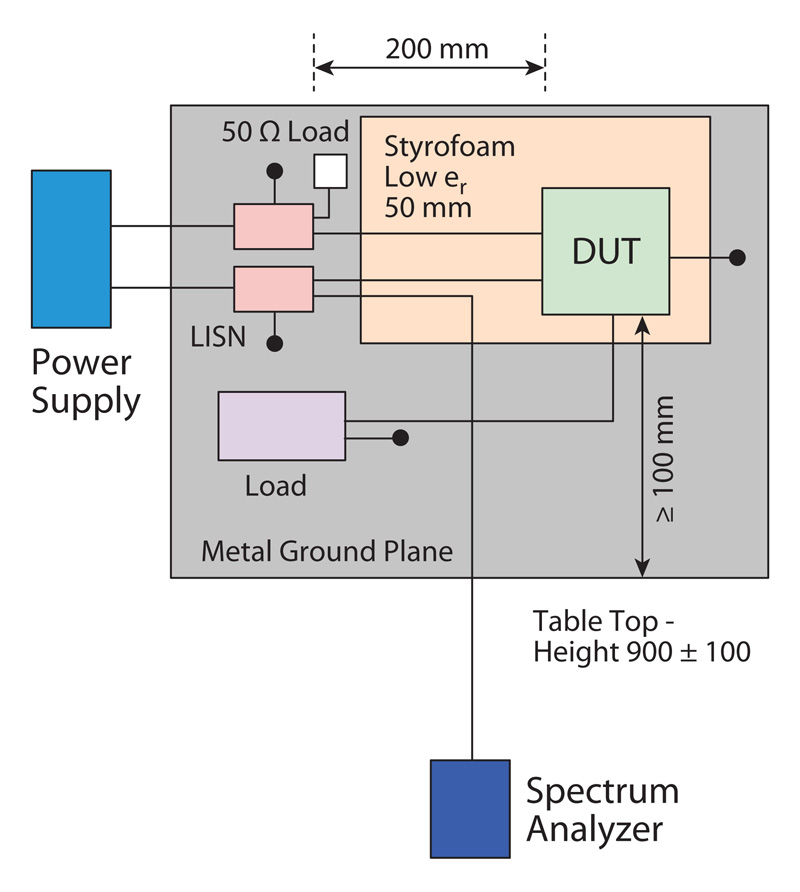
Figure 1: CISPR 25 conducted emissions measurement set-up
Switch Mode Power Supply technology has drawbacks such as the generation of switching harmonics. Converter waveforms are not a pure sinusoid and, consequently, they generate harmonics. The topology chosen and switching scheme deployed will directly influence the magnitude of harmonics generated.
The purpose of this application note is to guide the reader through the basics of conducted emissions testing using a low-EMI (Electromagnetic Interference) DC-DC converter solution. The Bourns Model HCTSM8 series transformers are used in this article to explain EMI measurement results.
The Need for Emissions Testing
To bring an electronic product to market, conducted emissions (CE) testing is performed to evaluate the electronic product’s EMI emissions. The emissions that the product transmits is measured and must not exceed a defined limit. EMI emissions are defined as any unwanted electromagnetic energy transmitted from a device. This can be divided into two categories: conducted and radiated. Conducted emissions must travel via a conductor such as through wires, PCB tracks and connectors. Radiated emissions travel from the source to a receiver via air.
Transformer parasitic elements such as leakage inductance and interwinding capacitance can have a significant influence on EMI emissions. Interwinding capacitance exists between primary and secondary windings. The primary winding imposes a voltage on this capacitance which causes common mode currents to flow across the barrier. A push-pull topology reduces the issue significantly by incorporating a balanced switching configuration with the common mode currents from each half of the winding cancelling each other out. The circuit used in this application note consists of the Bourns Model HCTSM8 push-pull series transformer and the Texas Instrument Model SN6501 push-pull driver. Together, they provide a superior DC-DC converter solution with low EMI.
Conducted Emissions Testing
EMI is governed by standards. Manufacturers must certify standards compliance in order to release their products. Testing is the critical gate to certification. The standard stipulates the maximum amount of allowable EMI emissions that can be emitted by the product during normal operation. It defines the test set-up as well, so measurements can be benchmarked fairly. The following describes how the test is performed according to the standard.
Test Set Up
EMI emission measurements can be made by the design engineer using a set-up as shown in Figure 1. This type of testing is known as pre-compliance testing. This will give the engineer a good idea whether the device will pass the EMI standard and allows for modifications to the design before the final product is sent for certification. Figure 1 displays the test set-up used. A spectrum analyzer is used to measure the emissions from the Device-Under-Test (DUT) and it is compared against the standard’s limits.
Understanding the Line Impedance Stabilization Network
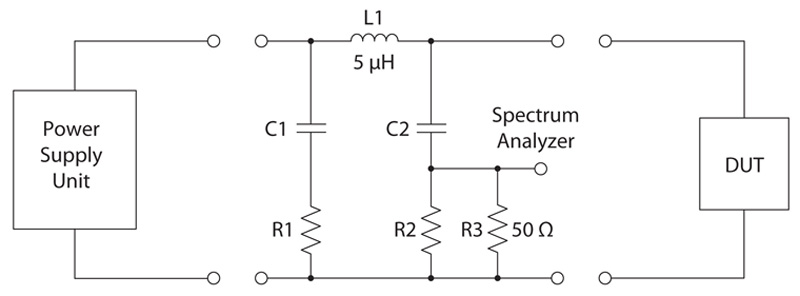
For CE testing, a Line Impedance Stabilization Network (LISN) must be used (shown in Figure 2). The LISN ensures that that the source impedance is defined and matches the spectrum analyzer’s input impedance (50 Ω).More importantly, the LISN must provide an accurate noise measurement of the DUT. The LISN will block any high frequency noise entering through the power lines from the power supply unit while also preventing any noise escaping through the power lines. The LISN will allow low frequency signals to pass.
Click image to enlarge
Figure 2: LISN diagram
CISPR 25
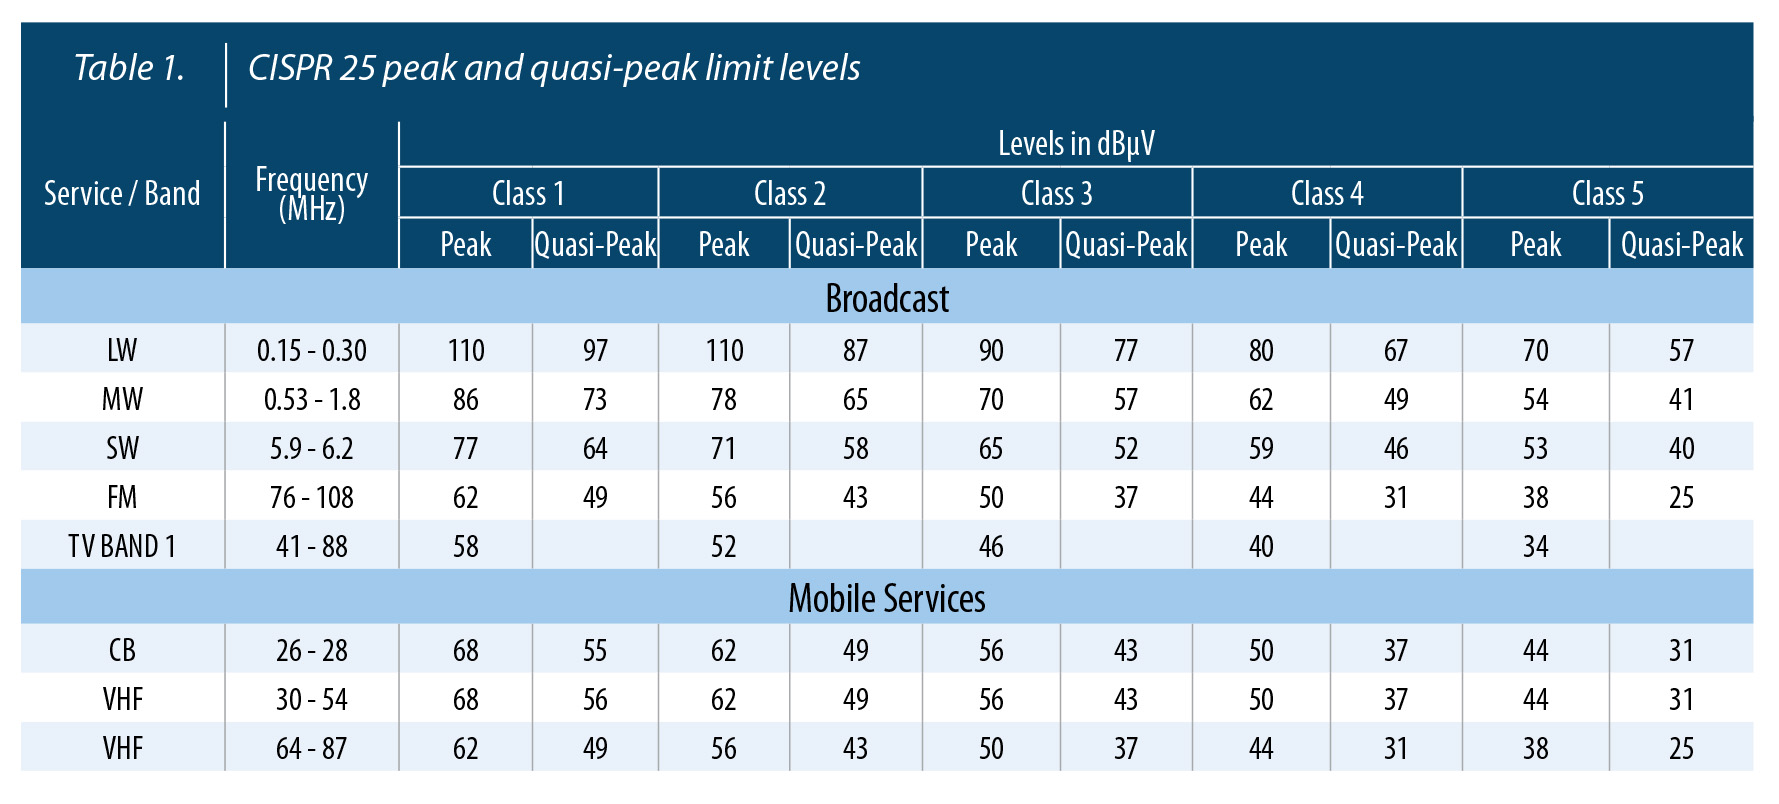
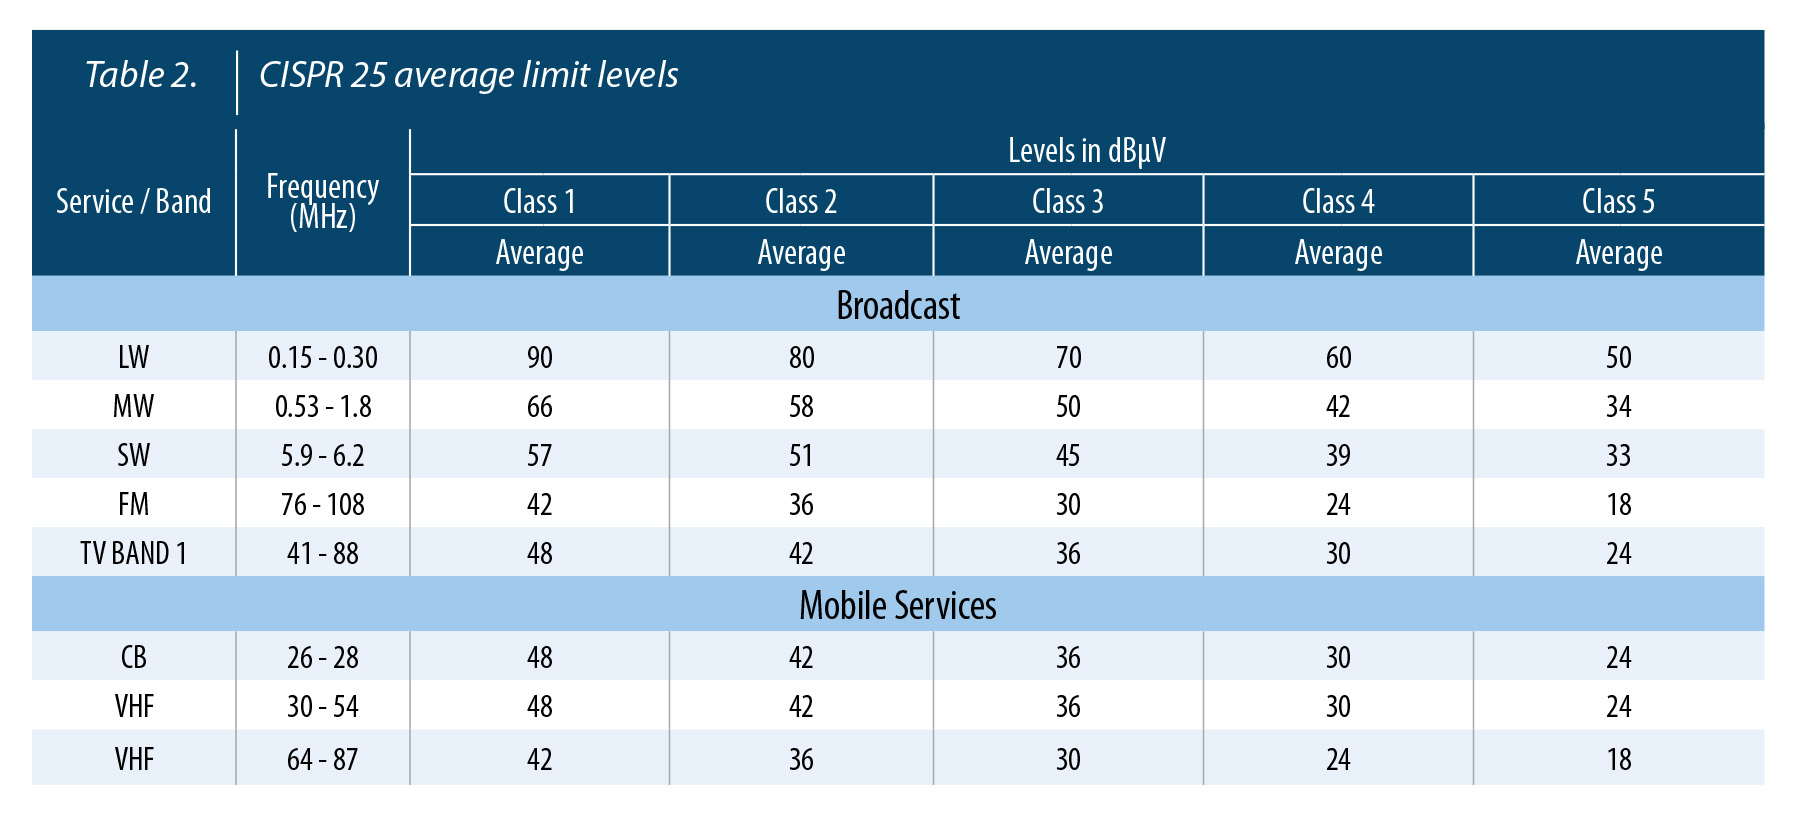
Power converters for automotive applications are tested according to the CISPR 25 standard.CISPR 25 is defined as the “Radio disturbance characteristics for the protection of receivers used on board vehicles, boats, and on devices – Limits and methods of measurement.” There are different classes defined in the standard, and a device’s class will be chosen based on where it is used in a vehicle system. There are five classes used where Class 5 has the most stringent limits. The permissible limits are displayed in Table 1 and Table 2.
Click image to enlarge
Table 1: CISPR 25 peak and quasi-peak limit levels
Click image to enlarge
Table 2: CISPR 25 average limit levels
Conducted Emissions Measurement
A detector is used to convert the time varying output of the LISN’s output into a fixed level for measurement. Quasi-Peak (QP) detection, Peak detection (Pk), and Average (AV) detection are the three methods typically deployed. The standard defines limit lines for each method. For pre-compliance, the best practice is to begin with peak detection. If the peak test is below the QP limit, then in most cases, it will pass the QP and AV limits as well.
Device-Under-Test Example
The Bourns HCTSM8 push-pull transformer series are used in isolated gate drivers or in battery management systems (BMS) for industrial automation, process control, and isolated interface power supply for CAN, RS-485, RS-422, RS-232, SPI, I2C. They have been tested and approved by Texas Instruments (TI) for use with their SN6501 push-pull driver. To illustrate EMI performance, EMI testing of a push-pull circuit using the SN6501 and HCTSM8 was conducted. Figure 3 displays the test circuit used for the EMI testing.

Click image to enlarge
Figure 3: Circuit 1 schematic
Test Procedure
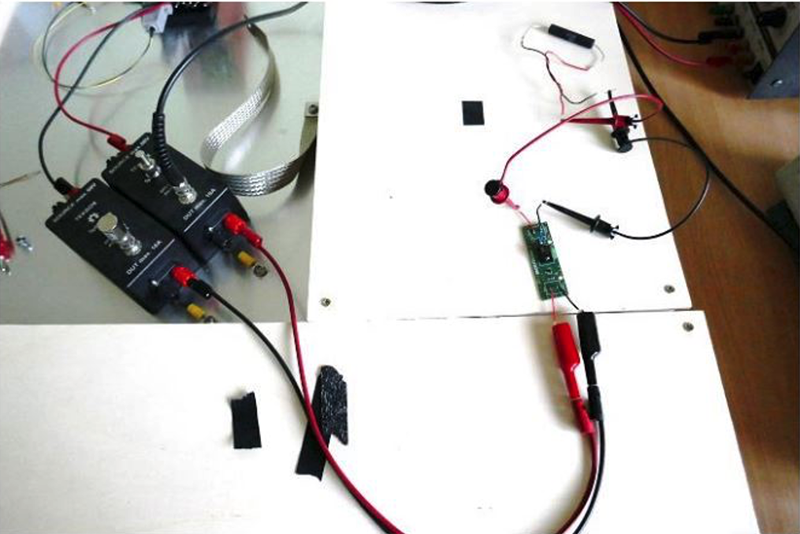
The test set-up is displayed in Figures 5. The set-up is in accordance with the CISPR 25 standard. A linear power supply supplies 5 V while two LISNs are deployed on each power line. A 50 Ωload is terminated on the return LISN port, while the LISN on the supply line is used to supply the noise measurements to the spectrum analyzer. A 100 Ω resistive load is connected to the DUT. An ambient scan is captured prior to turning on the powered up and then a peak measurement is performed. The highest harmonic amplitudes will be compared to the standard.
Click image to enlarge
Figure 4: Conducted emissions set-up displaying LISNs and DUT
Test Results
Peak detection is denoted in red while the blue trace is for average detection measurement. Note that the CISPR 25 Class 5 standard was chosen for evaluation. The green line displayed in the results indicates the quasi-peak limit level for a specific frequency band, while the blue line shows the average limit level for a specific frequency band. Peak detection measurement and quasi-peak limit levels is discussed in the results.
Ambient Trace
The ambient trace is displayed in Figure 6. This is an important step to execute prior to testing. If there are any large harmonics present, the tester will need to subtract the amplitude from any results measured.
Click image to enlarge
Figure 5: Ambient trace
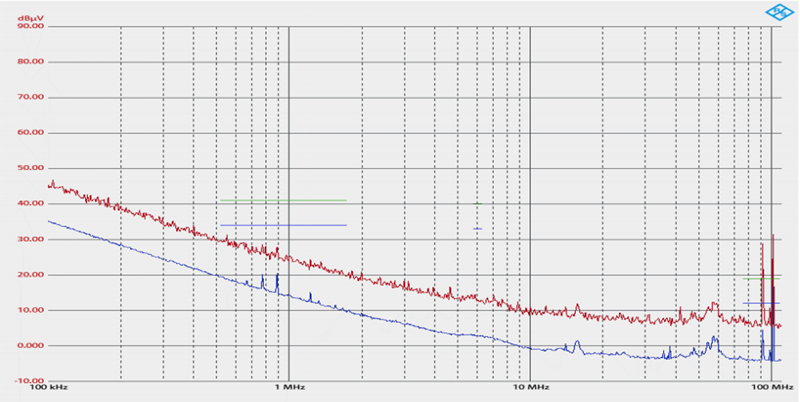
Vin = 5.00 V, Isupply = 99 mA, Load = 100 R, Vload = 6.249 V
Figure 7 displays EMI emissions results from for the Bourns HCTSM80304BAL transformer. The switching frequency is 420 kHz. Consequently, at 820kHz, which is a multiple of the switching frequency there is a large harmonic amplitude present. From 1MHz to 10 MHz, there is no signal that causes failures. At 100 MHz, the large harmonic peak can be subtracted due to its presence in the ambient scan.
Click image to enlarge
Figure 6: Transformer HCTSM80304BAL conducted emissions results
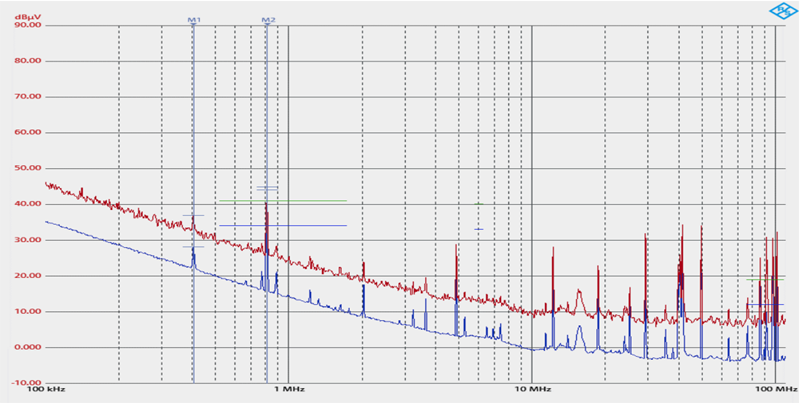
Vin = 5.00 V, Isupply = 18 mA, Load = 100 R, Vload = 1.632 V
Figure 7 displays EMI emissions results from for the HCTSM80803AAL transformer. There is a large harmonic amplitude at 820 kHz which is a multiple of the fundamental frequency and this exceeds the quasi-peak limit of 41 dBµV. From 1MHz to 10 MHz, there is no failures. At 100 MHz, the large harmonic peak can be subtracted due to its presence in the ambient scan.

Click image to enlarge
Figure 7: Transformer HCTSM80803AAL conducted emissions results
Conclusion
Designers of DC-DC power converters require a finished circuit that not only provides necessary power and efficiency goals at a competitive price but also one that is compliant to all applicable EMC regulations. This paper provided an overview of EMC requirements. This includeddetails on tests performed by Bourns on both an isolated 5 V solution using a Bourns Model HCTSM8 transformer and TI SN6501 driver IC circuit design. Measured results from testing were discussed and this data demonstrates that the combination of using the TI SN6501 and Bourns Model HCTSM8 solution was helpful in meeting standards compliance and required fewer interventions, ultimately contributing to a shorter time to market.