Equivalent Circuit Modelling for Li-ion Batteries
Battery management systems detect, protect and maintain the battery in a state in which it can fulfill its functional design requirement.
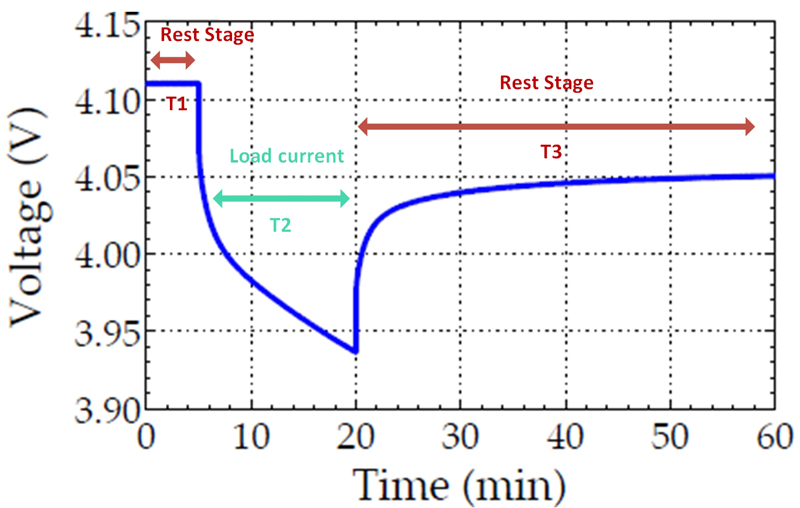
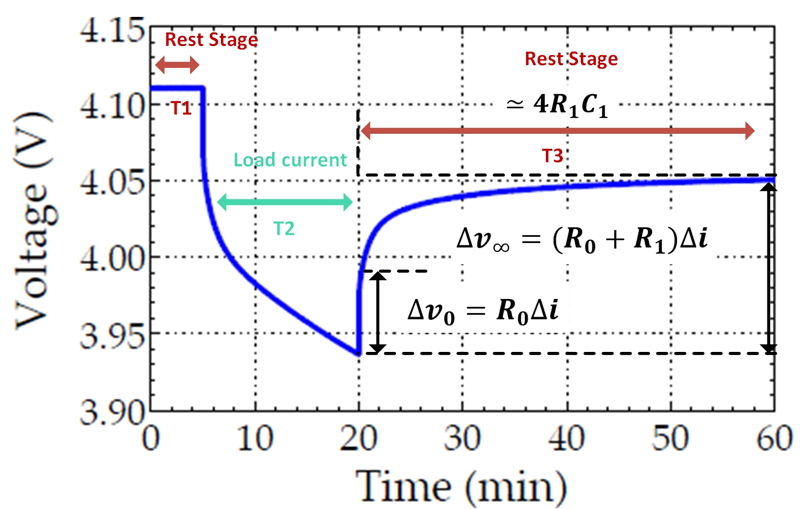
Figure 1: Polarization evident for Li-Ion
Lithium-ion batteries have been used during the last years in many applications as the most common energy storage devices (EV, stationary storage batteries etc). They gained wide popularity due to their high energy and power density, light weight, and wide working temperature range. However, they suffer from potential safety issues such as internal short-circuit and thermal runaway. We use the BMS to monitor the battery status in real time and to guarantee a reliable and safe operation in different use cases. The BMS also includes other functionalities like battery state, health, and power estimation. These estimations rely on a good battery model that we can divide into two categories:
• Electrochemical models based on understanding the underlying physics and building a model from the inside out
• Equivalent circuit models that use electrical circuit to define behavioral voltage approximation to different input-current stimuli.
The electrochemical models are time consuming and usually used to understand the reaction process inside the battery which yields to better accuracy than other battery models. The equivalent circuit models are based on an electrical representation using volage and current source, capacitors, and resistors.
SoC Dependent model
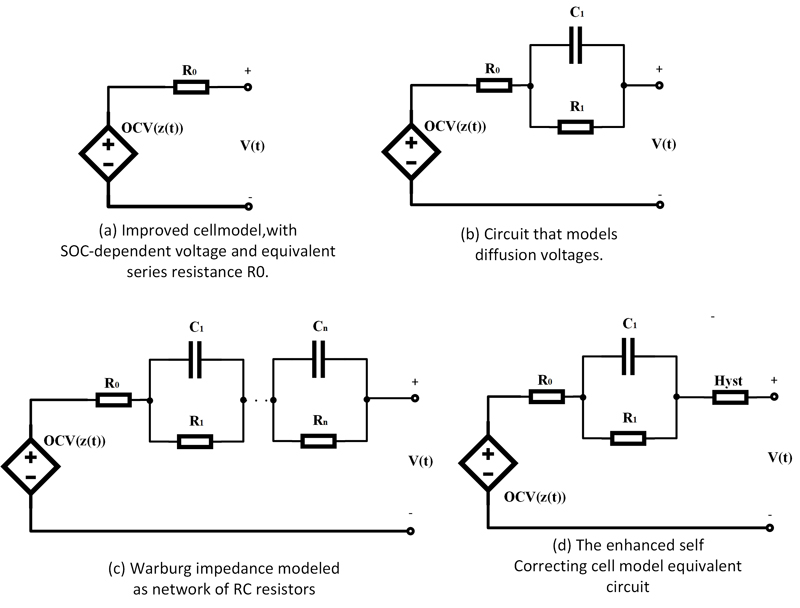
This first model is based on a voltage dependent source in series with a resistor (Figure 6 (a)). It describes the li-ion voltage behaviour in two cases:
• OCV: Open circuit voltage (Cell voltage in rest status) drop when the battery is subject to a load
• Terminal voltage rise above the OCV when the battery is being charged
This model can be described by two fundamental equations:
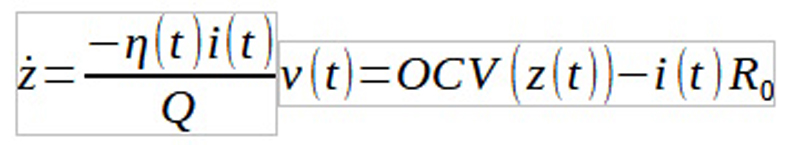
z is the SOC of the battery; η is the Coulombic efficiency v charge efficiency; i is the current supplied the load
The presence of this series resistance in the model also implied that power is dissipated by the cell as heat and therefore the energy efficiency is not perfect. This is a simple model suitable for many designs but not adapted for a large-scale battery pack such electric-drive vehicles and grid-storage systems.
Diffusion Voltage Model
Any cell on the market has some polarization effect that should be modeled. The Polarization can be defined as any departure of the cell’s terminal voltage away from open-circuit voltage due to a passage of current through the cell. Figure 1 illustrates an example of this phenomenon showing three stages:
• t=0 to t=5min: Cell at rest (T1)
• t=5min to t=20min: Cell is subject to continuous discharge current (T2)
• t=20min to t=60min: Load is removed, and cell is in rest stage (T3)
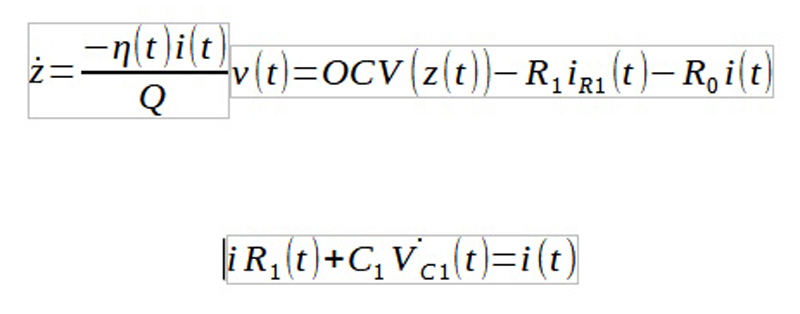
With the model the T3 stage is not well presented. We need to emphasise that this phenomenon is caused by the slow diffusion process of lithium-ion cell and commonly named diffusion voltage. Its effect can be approximated using one or more parallel RC subcircuits. This new model (Figure 6 (b)) can be described by the following equations:
We can also easily approximate the model parameters using a graphical approach:
Click image to enlarge
Figure 2: Graphical approach for parameter approximation
The model can be improved once we model the RC subcircuit in a function of the temperature and state of charge resulting in the model Figure 6(b).
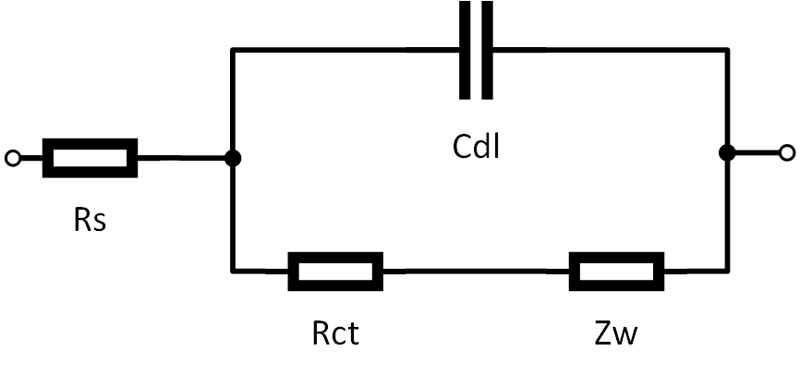
Warburg impedance model
Randles proposes an equivalent circuit model including a Warburg impedance element (Figure 5 (c)) where models the electrolyte resistance, is the charge-transfer resistance that models the voltage drop over the electrode-electrolyte interface due to the load, is the double-layer capacitance that models the effect of charges building up in the electrolyte at the electrode surface and is the Warburg impedance.
Click image to enlarge
Figure 3: The Randles circuit
The Warburg impedance models diffusion of lithium ions in the electrodes and its frequency dependent modeled as

Where Aw is called the Warburg coefficient and dependent on cell’s chemistry.
The Warburg impedance is usually approximated via a multiple parallel RC circuit connected in series (Figure 3) over some frequency range of interest. The capacitor is often omitted since it has a low impact at least at low frequencies. The impact at high frequencies can be studied when working with electrochemical models. Taking this into consideration, the final model collapses to the one in Figure 6 (c) which is basically the Diffusion voltage model with an RC network.
Enhanced self-correcting model
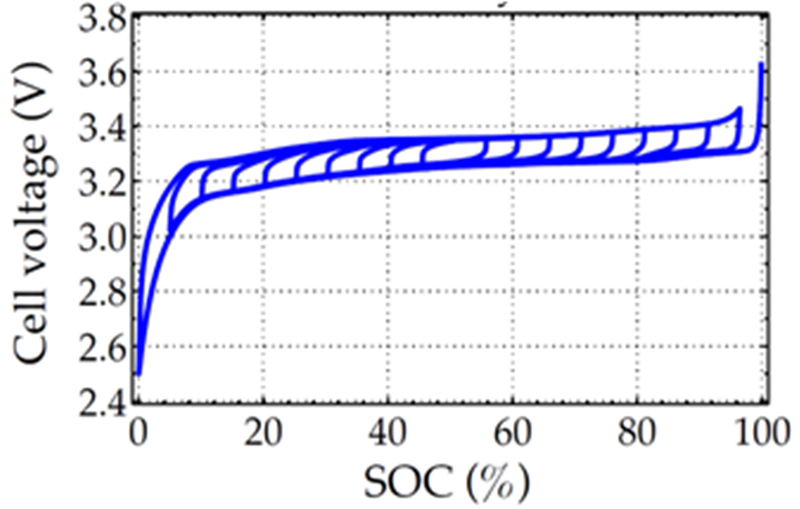
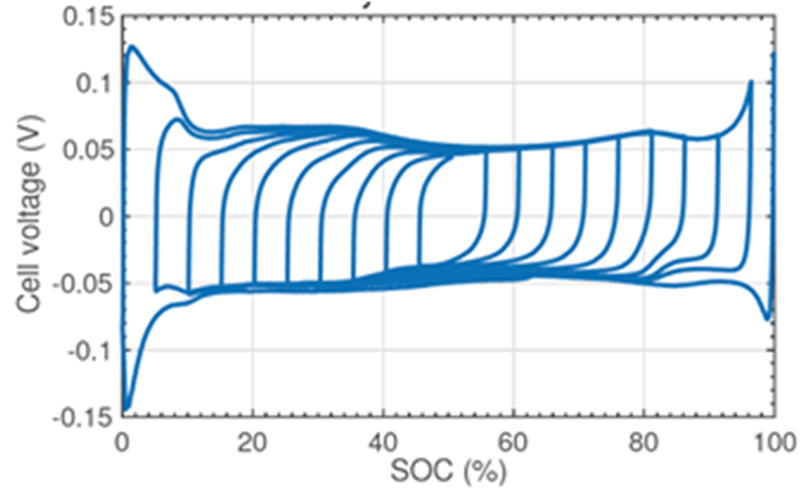
From real life tests, there’s another phenomenon to be modeled called hysteresis. This characteristic of the cell creates a mismatch between the voltage value at the end of charge/discharge and the one after the equilibrium and that depends on the recent history of the cell usage. An example is shown in Figure 4 & Figure 5 putting in evidence the impact of the hysteresis to determine the SOC. For a voltage of 3.3V, the SOC could correspond to any value between 20% and 90%.
Click image to enlarge
Figure 4: SOC Vs Cell voltage showing the evidence of hysteresis
Click image to enlarge
Figure 5: SOC Vs Cell voltage showing the evidence of hysteresis -without the OCV
We require a good model of hysteresis to know how different we expect the fully rested terminal voltage to be from the open circuit voltage.
When including the hysteresis in the previous models, we can introduce the enhanced self-correcting cell model that combines all the previous phenomenon (OCV dependency, diffusion voltage, Warburg impedance, hysteresis). Figure 6 (d) shows an example with single parallel RC, but we can imagine the same model with an RC network easily.
Click image to enlarge
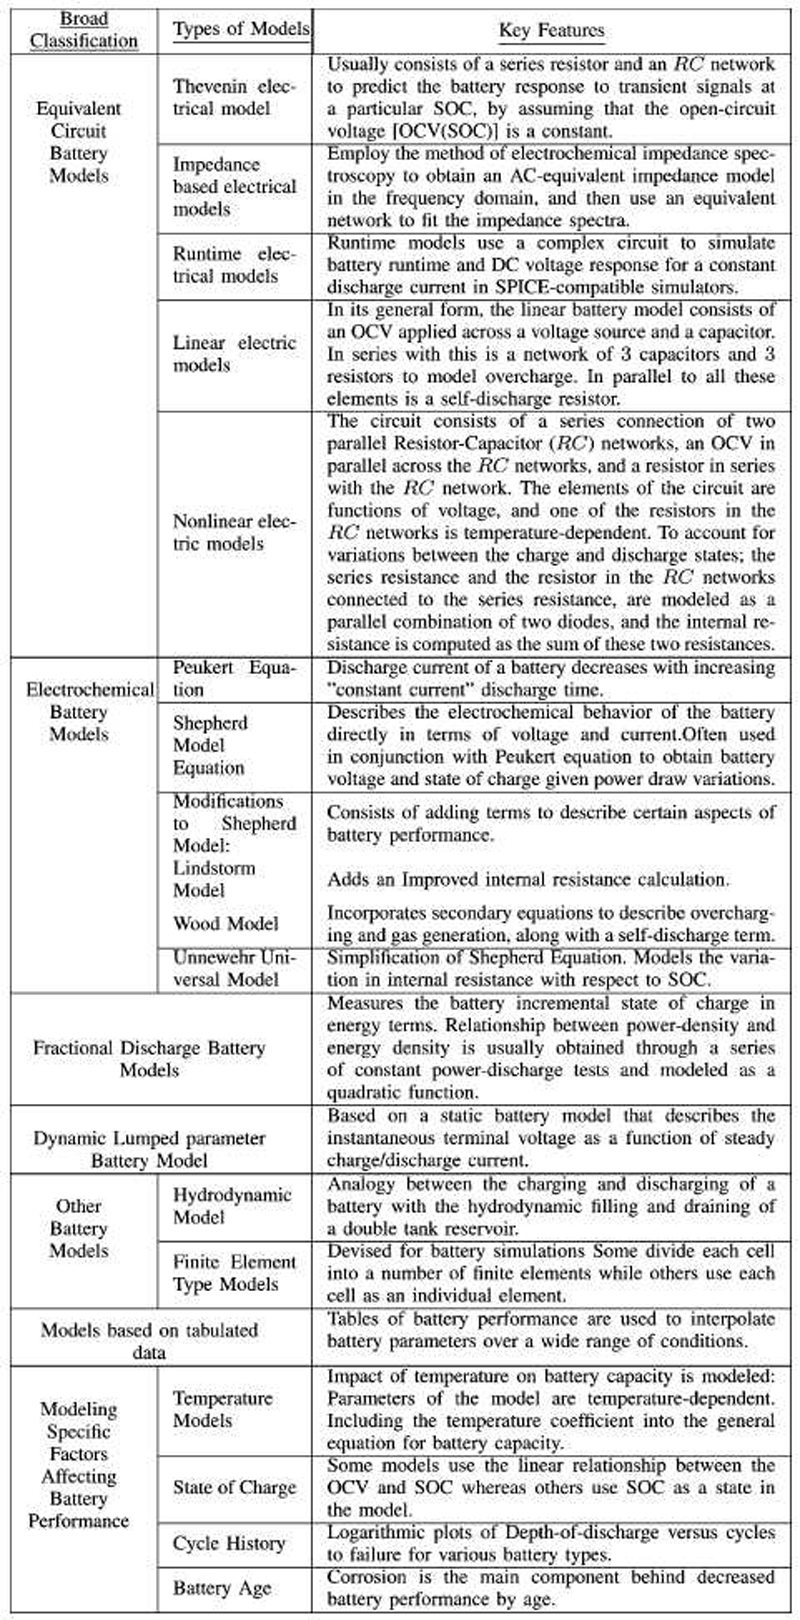
Table 1: Battery Models and key features
We can notice that our model gets to be more complex each time we include new characteristics of a battery cell. We have implemented these models into MATLAB/Simulink to test the accuracy and the characteristics of several types of cells that we can review.
Other models
Before moving forward to introduce the different methods to define the parameters of our models and reach the purpose of good estimation of SoC, SoH, SOP, we would like to mention that there are other models that improve and introduce some aspects of the battery cell such as:
• self-discharge of the battery
• The introduction of random noise
• Multi dependent parameters
• Linear regression model
These have been listed and summarized in Table 1. These models combine the different phenomena experienced during the battery test and presented in different forms.
Click image to enlarge
Figure 6: Equivalent circuit models
Identifications of the models
When developing ECM there are several parameters to be identified, such as RC network and serial resistor. These parameters are used afterwards to predict the different states of the cell (SoC, SoH, SOP) which are influenced by factors including current, temperature and aging.We distinguish between two main methods, namely: online, where the processing of the data is done piece by piece in a sequential manner without having it available from the start; and offline, where the entire data is available for the algorithm, which could only be implemented in a laboratory environment and may gradually lose fidelity during service. The online identification methods offer superiority over offline methods.
The online methods can be divided into two main categories, recursive methods such as the recursive least-square (RLS) and Kalman filter family where we benefit from adaptability and low computational effort. The non-recursive methods on the other hand, such as optimization algorithms, possess good accuracy and stability but at the cost of high computational effort and processing batches of data simultaneously.
Table 2 shows the three main methods that we will explore (Kalman filter family, fuzzy logic, artificial neural network) in a later article.
Click image to enlarge
Table 2: Summary of Different Techniques for The Determination of SoC
Challenges and Outlook
Online and offline parameter identification techniques have their own advantages and disadvantages. On one hand the online parameter identification reaches the optimal parameters estimation during live functioning by minimizing the errors between the estimated model and the measurement, which leads to preferable adaptability and robustness over offline techniques. Nonetheless, the online estimator shows limitation when working under high dynamic profiles. Furthermore, online techniques treat battery dynamics under excitation and during relaxation in a mutual time constant, which can lead to a poor battery voltage prediction. On the other hand, offline techniques are free of the limitation mentioned above and can capture model parameters and variation trends over different operating ranges.
Arrow Electronics has extensive experience in modeling batteries and building the software associated with estimation of state of charge, and state of Health.