Extending Laptop Battery Life in Real-World Usage Scenarios

Quiescent power of VR controllers prove to be critical in extending battery life for laptops
Laptop battery life in the real World
Introduction
Laptop battery life estimates advertised by OEMs are rarely accurate, but they are a major selling feature for a product. Laptops that can last an entire day of use (10+ hours) on a single charge often command two to three times the price of a laptop that has a run time of a few hours. A lot of engineering goes into making a laptop battery last longer while still delivering the performance. The need for a common metric for testing battery life has led companies like BAPco to specify exactly how a laptop must be tested under various conditions in order to generate a benchmark that can be applied to all companies. The company is now on its 3rd generation of mobile mark programs, with mobile mark 2014 and mobile mark 2018 being superseded by the recently released mobile mark 25.
A system under test is compared against a calibrated system and rated for productivity, creativity, and responsiveness. This ensures that a system manufacturer cannot simply degrade the performance of the system in order to showcase a good battery life. These three performance categories are broken up into the real application scenarios, including document editing, web browsing, Photo/Video editing, application launching, etc., to mimic the end-users.
The battery life rating for Mobile Mark 25 is calculated by measuring the actual battery duration observed (from a fully charged state to a fully depleted state) in whole minutes while running all scenarios (PR->CR->RE) in repetition. For readability, the battery life rating is displayed in hours and minutes.
For more details on the performance benchmarks, refer to BapCo’s whitepaper: https://bapco.com/wp-content/uploads/2022/02/bapco_mobilemark_25_white_paper_v1.2-1.pdf
Understanding System Power Consumption in Battery Life Workloads
A laptop SoC’s current draw and load residency under various battery life workloads is shown in Figure 1. The key application scenarios shown are Idle, full-screen video playback (FSVP), web browsing, and MM14 (Mobile Mark 2014). Although it may not be intuitive that the SoC current consumption is, for the most part, below 3A, that’s exactly what the lab data shows. In fact, the SoC current consumption is less than 3A for an incredible 95% of the time. For a very common use case (watching a movie or YouTube video, for example), the SoC Core and graphics (GT) consume a < 100mA for 67.1% (Core) and 88.6% (GT) of the time! Given that the output voltage is only 0.4V at that time, the power consumption of the SoC is 40mW (100mAx0.4V=40mW) during this time.

Click image to enlarge
Figure 1. SoC current draw and residency in Battery life workloads. Residency implies the percentage of time the SoC draws that current. A 3 rail SoC has Core, Graphics, and a Peripheral Rail.
A laptop being used in FSVP has two main power draws; the SoC and the display, assuming that the video is downloaded and Wi-Fi is not running. By knowing the average power a typical display consumes at a fixed brightness, it’s possible to calculate the battery life for that particular usage mode. The same can be done for the other typical use cases shown above. However, the actual measured battery life was up to an hour shorter than expected from the calculation. There’s obviously a ghost power drawn from somewhere in the system that affects the expected results versus the measured.
The FSVP mode of operation is a good example of tracking down ghost power draw in the system because very little else in the system is running other than the SoC and the display. The voltage regulator for the SoC is assumed to be highly efficient and therefore not a big source of power loss. However, is this assumption correct? While efficiencies of voltage regulators are often 90+%, this is true at loads higher than 5A. But as the table above shows, battery life workloads are in the 0-3A range. So, what exactly is the efficiency of a VR for a multi-rail SoC at the load currents that matter (0A-3A)?
It turns out that at light loads, it is not the power stage switching losses or conduction losses that dominate. The reason for this is straightforward: at loads below 3A, VRs fold back switching frequency, and conduction losses are low due to low currents and very low RDS(ON) power stages. For example, AOS’ AOZ5517 DrMOS power stage has a low side RDS(ON) of 1mOhm and a high side of 4mOhm. Systems designed with products like the AOZ5516 and AOZ5517 power stages are capable of high performance when the laptop system is plugged in and is configured for maximum performance. In battery life workloads, it turns out, the real culprit is the multiphase controller quiescent power.
A quick survey of available multiphase controllers in the market showed that multiphase controllers commonly draw 10s of mA/ rail. As newer laptop SoCs require two or even three rails, multiphase controllers supporting these new SoCs draw up to 100mW-160mW. In the example above, where we pointed out that the SoC was drawing a mere 40mW, the VR efficiency using a multiphase controller with a quiescent power of 160mW can offer a mere 20% efficiency!
While this seems ridiculously low, it’s a result of VR controller vendors focused on peak/heavy load efficiency while the battery life workloads test VR efficiency at very light load. Improving light load efficiency, therefore, requires a paradigm shift in multiphase VR development.
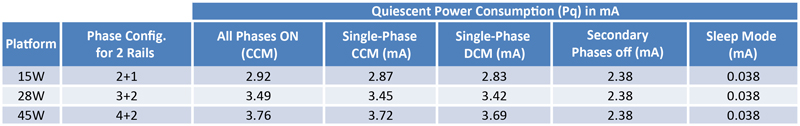
This is exactly what Alpha and Omega Semiconductor set out to do with its newly released two-rail, 6-phase controller released for the laptop market. With attention to multiphase VR controller quiescent power consumption, the AOZ71026 offers low power consumption in various configurations. Figure 2. shows various phase configurations for multiple laptop form factors/performance levels and AOZ71026 power consumption under various modes of operation with all phases on, single phase continuous conduction mode (CCM), single-phase discontinuous conduction mode (DCM), sleep mode (system in a sleep state with VR ready to wake within 100us) and a mode where the unused phases (power stages) are turned off.
Click image to enlarge
Figure 2. Multiphase controller quiescent current. Test condition: Data taken on AOZ71026 IMVP 9.1 multiphase controller. EN = EN_SMB = HIGH, VCC = PVCC = 5V. FSW = 800 kHz
As can be seen, in all conditions, the AOZ71026 consumes less than 20mW. This puts it far ahead of controllers mentioned above that take in excess of 150mW. This industry-leading low power consumption was achieved by a unique “Hybrid Digital” design approach that allows for the best of both worlds: the low power consumption of high performance, yet power-sipping, analog control loop while still enabling the feature-rich programmability and low external component count of a digitally programmable controller. Following on products like the three rail, 12 phase AOZ71037QI will continue to offer the best in class low quiescent power. In fact, as future laptop SoCs require three multiphase controller rails (to power core, graphics, and peripherals), this low Pq design approach will become even more appealing as each rail takes only 1.5mA versus 7-10mA for competing products.
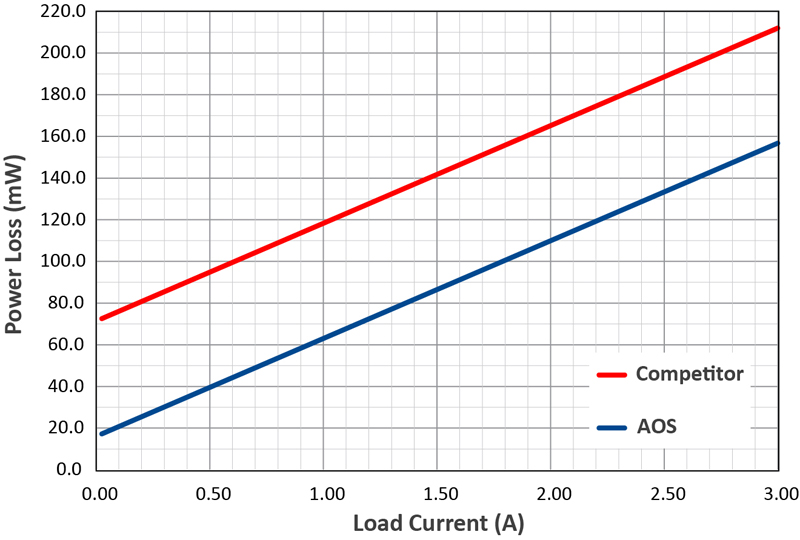
Indeed, PQ is such an important factor in VR light load efficiency that it has led chipset vendors to recommend plotting power loss instead of efficiency to demonstrate the “floor” or 0 load power consumption of the voltage regulator. Figure 3 shows the AOS controller versus a competitor three rail controller. Power stage efficiency (and hence power loss) at those loads are similar, so the VR controller Pq dominates the power loss difference (delta).
Click image to enlarge
Figure 3. VR Controller Power Loss for AOS versus Closest Competing Product
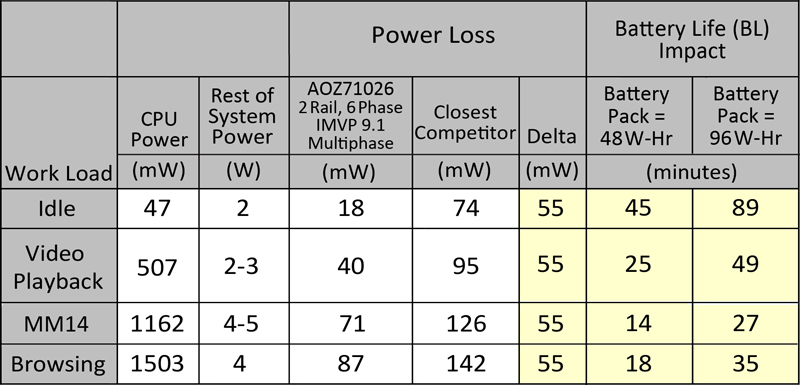
So, what does this mean for battery run times? Does this delta really help? It turns out that it does, and the battery life (BL) impact in minutes for various workloads for a 48W and 96W hour battery is shown in Figure 4a.
Click image to enlarge
Figure 4a. Table showing battery life (BL) improvement calculation for AOS multiphase solution using AOZ71026 versus nearest competing solution
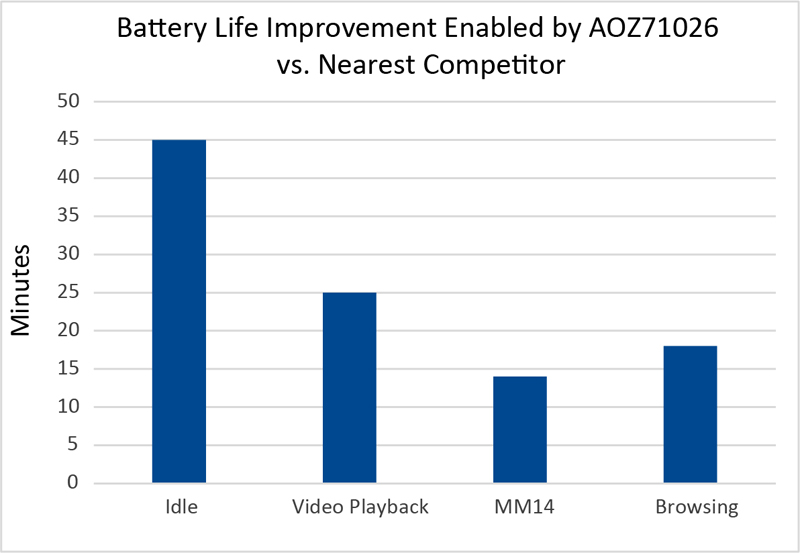
As AOS’s solution saves ~ 55mW on Pq, it can provide 25 additional minutes of battery life than the next best solution. In idle/MM14/Web Browsing scenarios, AOS can also increase the battery life by 45/14/18 mins, respectively, as shown in the graph in Figure 4b.
Click image to enlarge
Figure 4b. Increased battery life in minutes for a system powered with AOS’s AOZ71026 multiphase controller versus the nearest competitor for a 48W-hr battery pack
Conclusion
Battery life can be extended through good system design and, to a certain extent, by how the user configures the system to operate while in battery mode. However, there are practical limits, a display’s brightness cannot be turned down too much, and Wi-Fi cannot be turned off in most workloads. Battery life improvements must be eked out in minutes. The fact that VR controller Pq can have such an impact on battery life has prompted CPU vendors such as Intel to state that Pq should be the #1 criteria for selecting a VR controller if battery life is a key consideration in the system design.
Further methods to improve battery life for laptops continue, and voltage regulator topology and feature sets continue to be at the forefront of laptop battery life improvement. These will be discussed in a future article as this research finds its way into products powering next-generation high-performance laptops.