Input Impedance Measurements and Filter Interactions - Part I
In this article, Dr. Ridley continues the discussion of input impedance measurements, and shows the effect of properly locating all of the input filter components. Middlebrook's input filter stability criteria only apply to the system measured with the filter components in the correct location.
Input Impedance Measurements
As discussed in the last article, an input impedance measurement gives information about the characteristics of the power supply input terminals. The measurement is usually a requirement of the documentation package in the aerospace industry. The input impedance measurement is very useful for anyone that has to add components to the basic power supply design. This can include an input EMI filter, or another power supply that preconditions the input voltage rail.
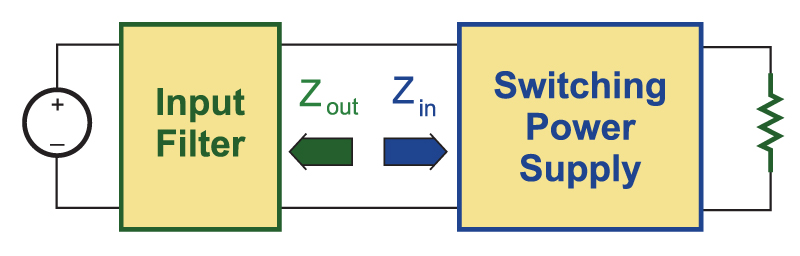
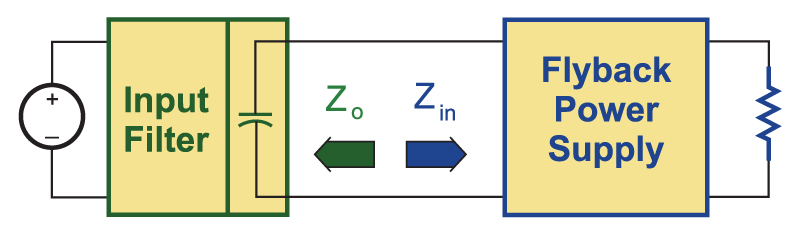
Figure 1 shows a block diagram of a switching power supply connected to an input filter. Dr. Middlebrook, in his famous paper on input filter interactions, said that the if the input impedance of a converter, Zin, is always greater than the output impedance of the filter, Zout, then a stable power supply will remain stable when the filter is connected [2]. Measurements of both the filter output impedance, and the power supply input impedance are useful for predicting the stability of the resulting power system.
Click image to enlarge
Fig. 1: Power supply with input filter module
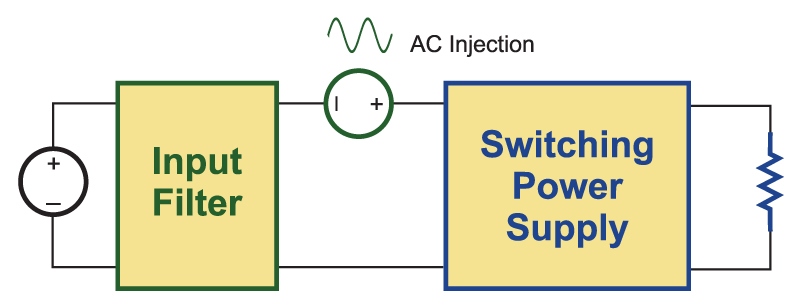
The impedances can be measured with the diagram shown in Figure 2. An ac voltage source is connected in series between the filter and the switching power supply. The input impedance is measured from the ratio of the input voltage of the supply and the current into the terminals. The output impedance of the filter can be measured with the same injection setup with the voltage probe at the output of the filter. The filter output impedance can also be measured with power removed from the circuit, as will be described in the next article.
The practical implementation of the voltage injection and measurement is described in detail in [1].
Clcik image to enlarge
Fig. 2: Voltage injection into the power rail for impedance interaction measurements
The Middlebrook criteria require that the power supply block of Figure 2 contains only the switching cell, and none of the input filter components. However, it is usually a practical necessity that at least one filter component is included in the power supply block to filter high-frequency pulsating currents. Without this, measurements can be too noisy and the converter may not operate properly. Also, in many cases, the internal circuit nodes for measurement are inaccessible, and the power supply input impedance measurement will include several filter components.
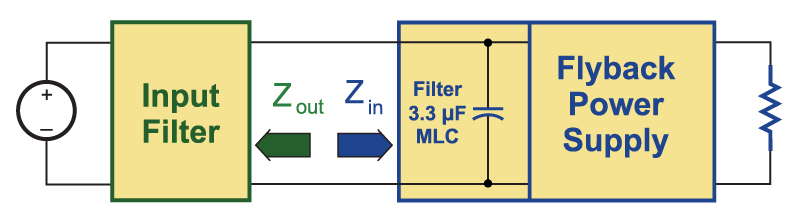
Figure 3 shows a measurement setup where a small input bypass capacitor is included in the power stage measurements. As we will see, this has a significant impact on the input impedance measurements, greatly reducing the impedance at higher frequencies.
Click image to enlarge
Fig. 3: Flyback converter with input filter capacitor. In most cases, practical measurements require some input filter components to be included in the impedance measurement
Figure 4 shows the proper location for application of the Middlebrook criteria. The filter capacitor is moved into the input filter block, and is not included in the power supply block.
Click image to enlarge
Fig. 4: Proper characterization of the impedance interaction requires the input filter capacitor to be moved to the filter module
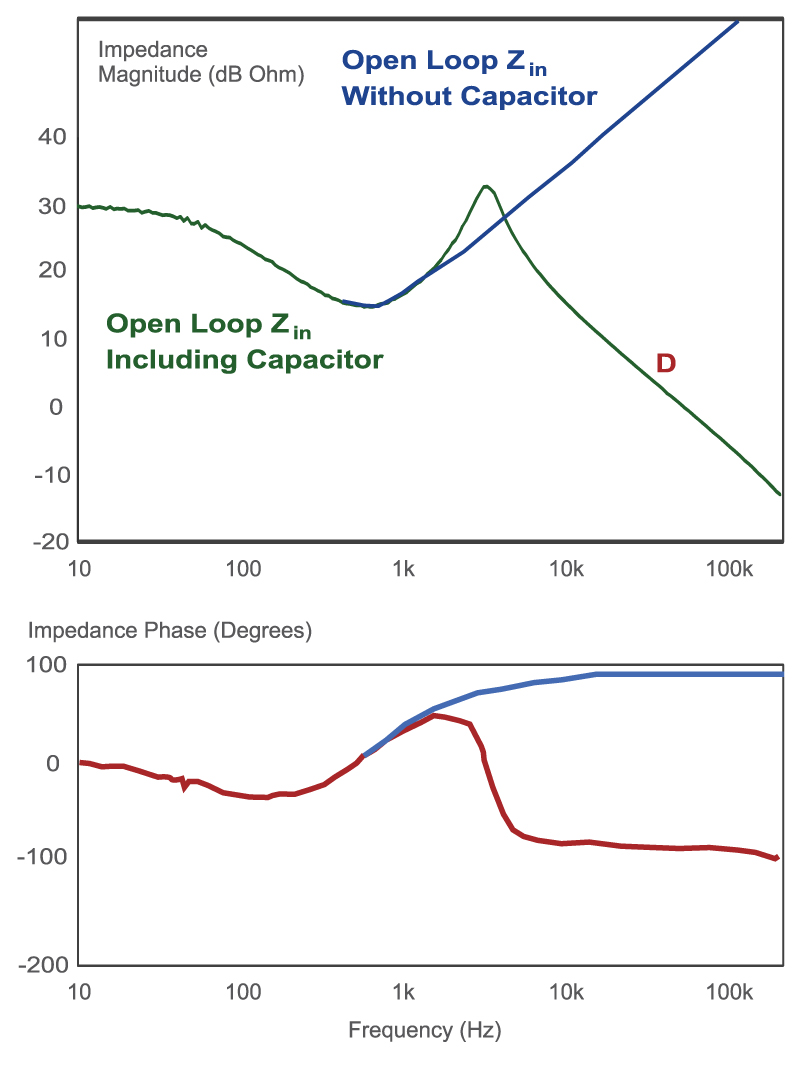
Figure 5 shows the effect of the capacitor location on the open-loop input impedance measurements. The curve shown in green is the input impedance measured with the capacitor at the front of the power supply. The final impedance follows the asymptote D. Notice that the final value of the phase measurement is -90 degrees, corresponding to the capacitive impedance.
If the capacitor is moved to its proper place at the output of the filter block, the curve shown in blue results. Notice that the input impedance is much higher for this situation at higher frequencies. The final asymptote is determined by the inductor of the power stage.
Click image to enlarge
Fig. 5: Open-loop input impedance measurements of a flyback converter with and without input capacitor
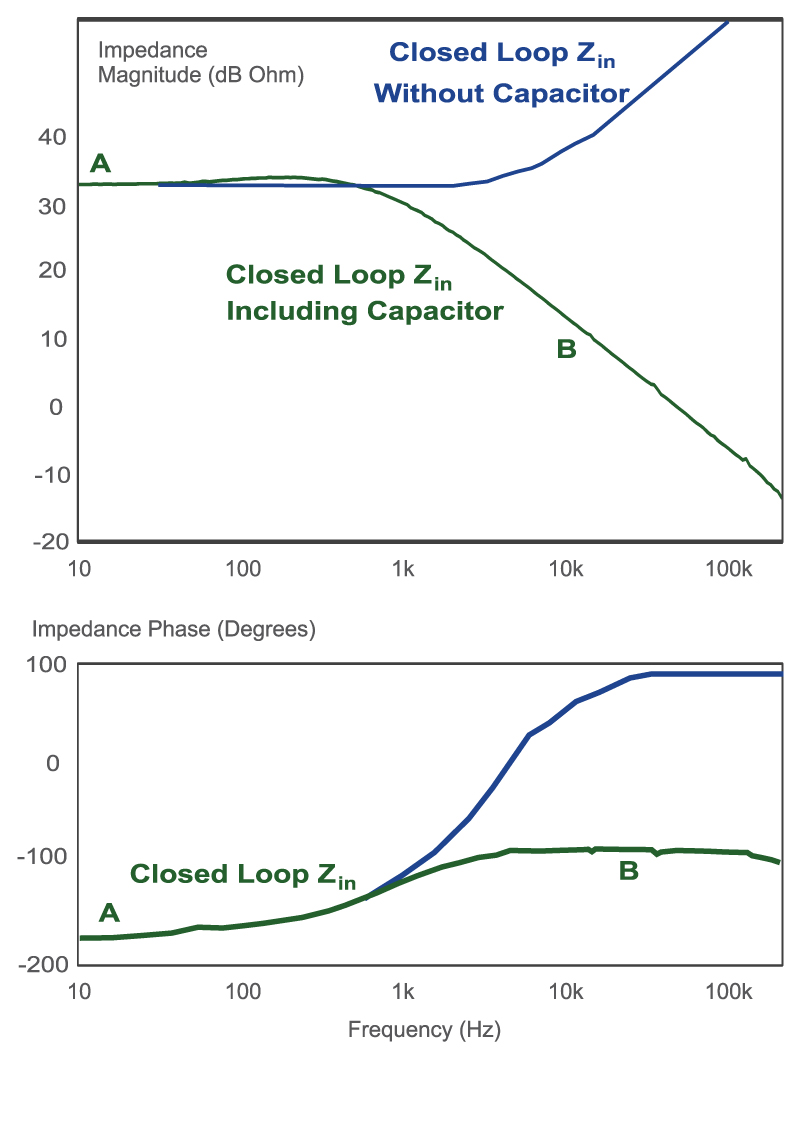
Figure 6 shows the input impedance of the same converter with the control loop closed. If the measurement is made without the input capacitor, the impedance is flat at low frequencies, with a negative value, and rises beyond the crossover frequency of the control loop. This is shown by the blue curve.
If the input capacitor is included in the measurement, the impedance drops substantially at higher frequencies.
Click image to enlarge
Fig. 6: Closed-loop input impedance measurements of a flyback converter with and without input capacitor
For the power supply in this article, the input capacitor on the right of the measurement point is a small 3.3 ÂμF multilayer ceramic. It is possible in this case to subtract the impedance of the capacitor from the measurements to predict the input impedance with the capacitor removed. In many real world supplies, it is not possible to modify the filter component connection or to get at the necessary circuit nodes. Large values of capacitor can be included in the measurements, and this makes proper application of the Middlebrook criteria very difficult.
Summary
This article discusses the significance of power supply input impedance with respect to the input filter interaction criteria. It is shown how small filter components included in the input filter measurements interfere with proper application of the Middlebrook criteria. In the next article, measurements of the input filter output impedance will be discussed to show how this can interact with the power supply.
References
1. Ridley Engineering Design Center, www.ridleyengineering.com/index.php/design-center.html, Article [59] Input Impedance Measurements.
2. "Power Supply Design. Volume 1: Control", by Dr. Raymond B. Ridley. Full-color textbook available at www.ridleyengineering.com/index.php/books.html.