In this third part of this series of articles, Dr. Ridley discusses the fourth important frequency-response measurement made during full characterization of a switching power supply. The closed-loop input impedance is measured to be a negative resistance at low frequencies. The input impedance of a power supply is also complicated by the inclusion of input filter parameters in most practical measurements that are made.
Power Supply Transfer Function Measurements
There are four fundamental transfer functions that characterize the small-signal performance of a switching power supply. They are as follows:
- Loop gain and phase â€" determines the stability of your design, and available margin to accommodate variations in components.
- Output impedance â€" determines the output regulation, dynamic load response, and susceptibility to complex loading.
- Audiosusceptibility â€" determines the transmission of noise from input to output.
- Input impedance â€" determines the sensitivity of the power system to input filter or input power system components.
The first three parameters, loop gain, output impedance, and audiosusceptibility were discussed in the first two articles of this series. It is highly recommended that all three of these measurements are made on every switching power supply that you design and build. The loop measurement is essential to guarantee stability over the lifetime of the power supply, and the output impedance gives comprehensive information about the performance in the presence of load variations. The audiosusceptibility is measured is very useful for showing the rejection of noise from input source to output.
An input impedance measurement gives information about the characteristics of the power supply input terminals. It is usually a requirement of the documentation package in the aerospace industry. As with the audiosusceptibility measurement, a signal must be injected on top of the high-power input rail. Once you have set up your test equipment to do audiosusceptibility measurements, input impedance measurements are straightforward to do.
Input Impedance Measurements
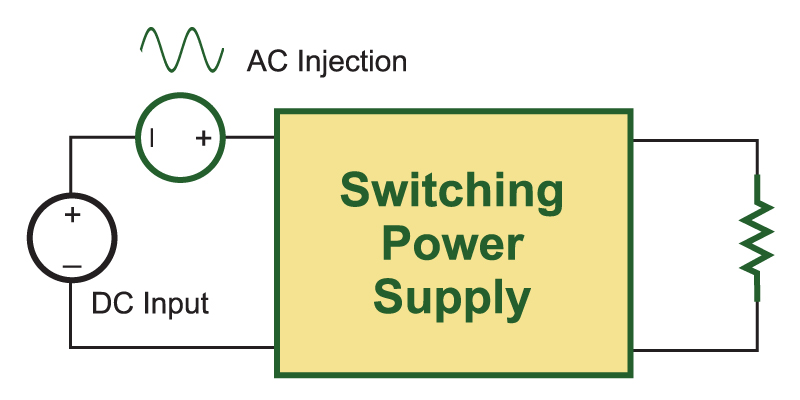
The input impedance measurement can predict how well the power supply will integrate into a system. If the input impedance is too low, it can load down the source and provide adverse system interactions. In order to measure input impedance, a voltage source must be injected in series with the input of the power supply as shown in Figure 1.
Click image to enlarge
Fig. 1: Input impedance is measured by adding a voltage signal at the input terminals of a power supply and measuring input voltage and input current perturbations.
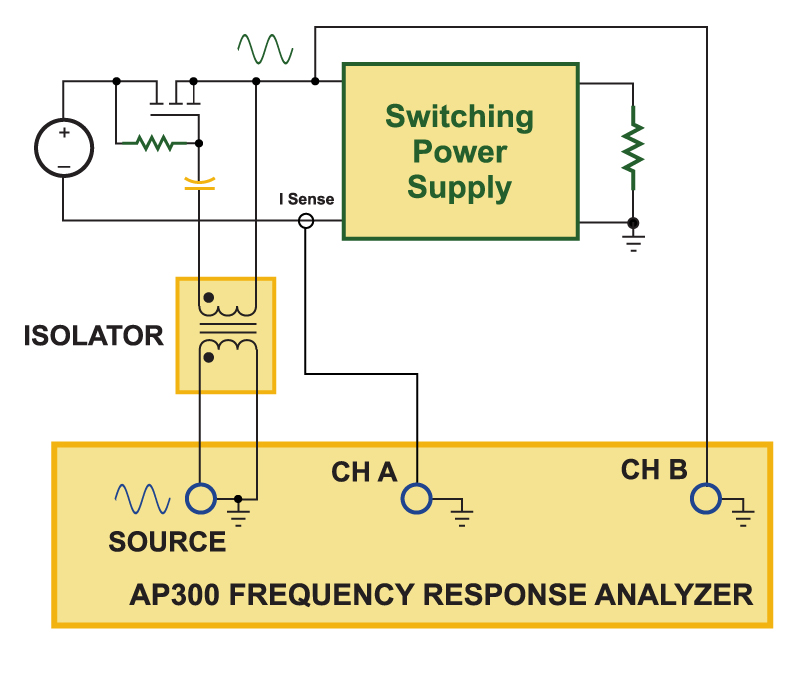
Figure 2 shows how this is implemented practically using a frequency response analyzer and a few discrete devices. The output of the analyzer is connected to wide-bandwidth isolator which is then AC coupled to a FET hooked up as a voltage follower. The size and rating of the FET may vary according to the power level and voltage level of the converter that is being driven. This injection technique is much simpler and more cost effective than inserting a high-power amplifier in series with the input source, and will allow sufficient signal to be injected for most applications.
The only difference between this setup and the setup for audiosusceptibility is that the signals sent to the analyzer are different. For input impedance measurements, Channel B of the analyzer measures the input voltage perturbation, and Channel A measures the input current perturbation. The current is measured with some kind of transducer â€" either a small sense resistor, current transformer, or active probe.
Click image to enlarge
Fig. 2: Practical test setup for injecting voltage signal and measuring input impedance.
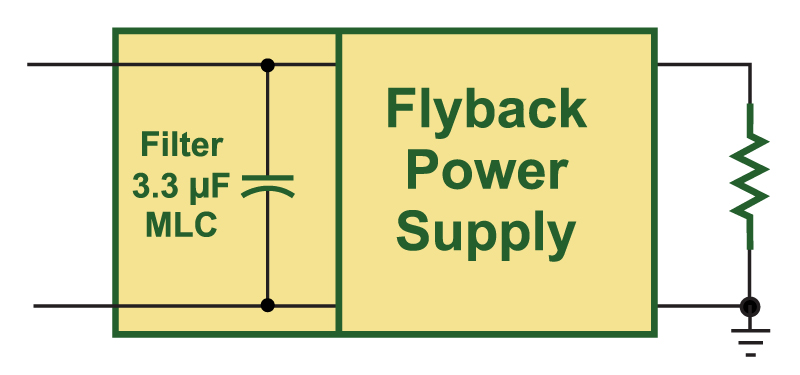
Dr. Middlebrook, in his famous paper on input filter interactions, specified that the input impedance of a converter should be analyzed and measured at the switching cell input. This is the point at which the interaction analysis can be properly applied to predict whether the input filter will affect the control loop. However, in most practical situations, the input impedance measurement includes some or all of the input filter components in parallel with the input impedance of the power supply. This can lead to false low measurements that are not relevant to Middlebrook’s original discussions. More information on this topic can be found in [3].
Click image to enlarge
Fig. 3: Flyback converter with input filter capacitor. In most cases, practical measurements require some input filter components to be included in the impedance measurement.
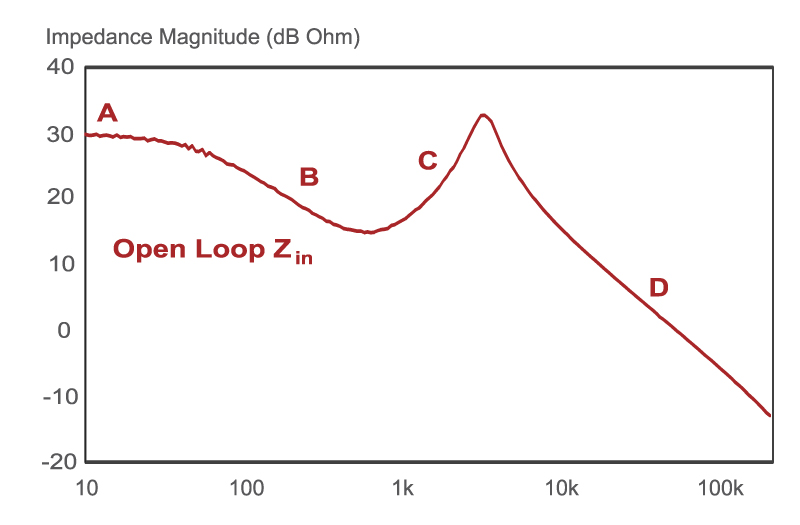
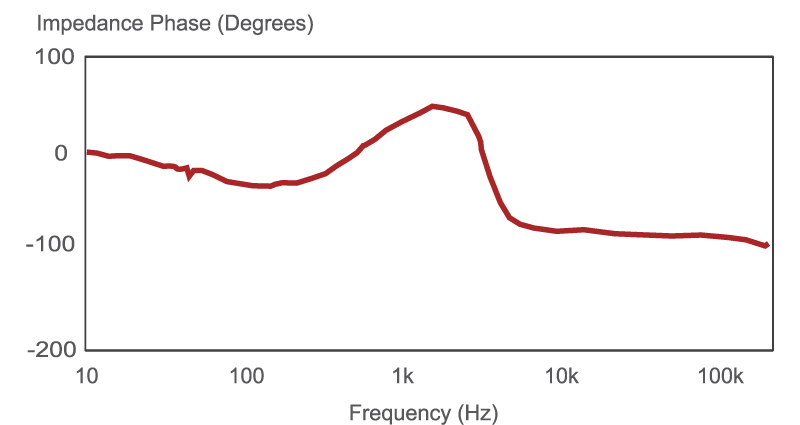
Before closing the control loop on a converter, it is useful to measure the open loop input impedance of the power supply. The results of this measurement are shown in Figure 4. There are four asymptotes to gain curve of this figure. The first, A, is proportional to the load resistance of the converter. Notice that the phase of the impedance at this point is zero degrees, denoting a positive value of resistance.
Click image to enlarge
Click image to enlarge
Fig. 4a & 4b: Open-loop input impedance measurement of a flyback converter.
Just before 100 Hz, the asymptote B is due to the output capacitance of the power supply, and the input impedance starts to drop. This continues until to the resonant frequency of the LC filter of the power supply, and then the impedance climbs along asymptote C, according the value of the flyback inductance.
Eventually the impedance of the input filter capacitor becomes lower than the impedance of the inductor, so the final impedance follows the asymptote D. Notice that the final value of the phase of the input impedance is -90 degrees, corresponding to a capacitive value.
The open-loop input impedance is quite a complex curve, even with just a single capacitor as the input filter. With more complicated input filters included in the measurement, the complexity of the measured or predicted impedance will increase.
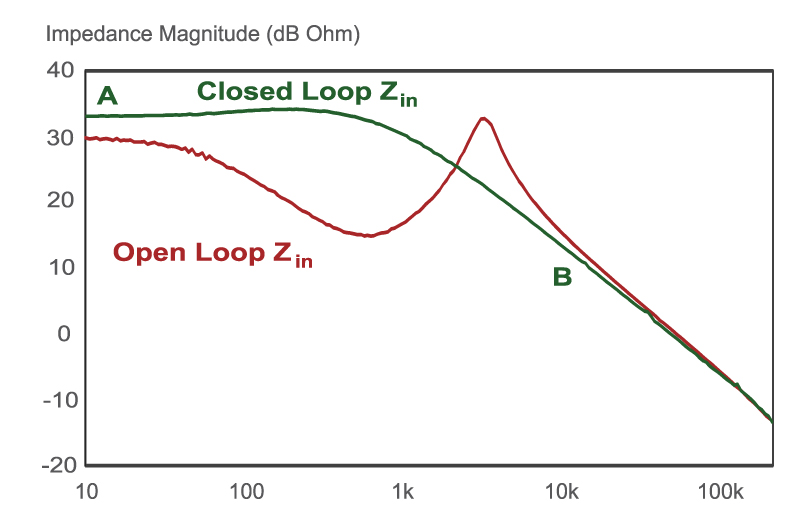
Figure 5 shows the input impedance of the same converter with the control loop closed.
Click image to enlarge
Click image to enlarge
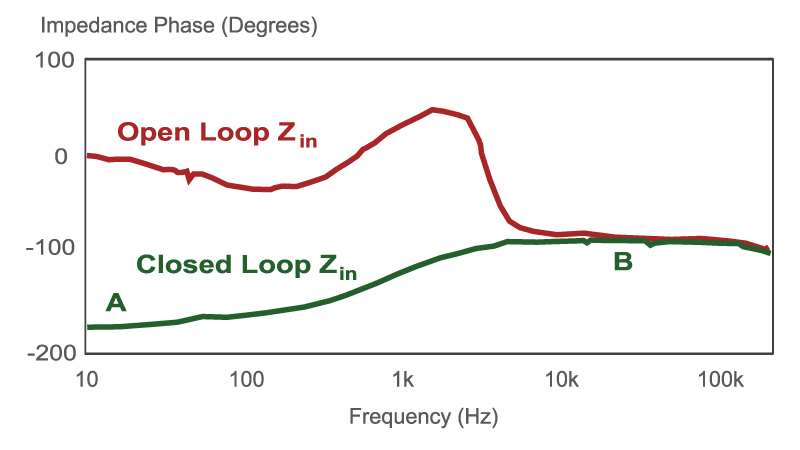
Fig. 5: Closed-loop and open-loop input impedance measurements of a flyback converter.
The green curve of Fig. 5 shows the closed-loop input impedance of the converter. At low frequencies, along asymptote A, the dc value is determined by the power output of the converter and the input voltage. You can see from the green phase curve that the impedance now has a starting phase of -180 degrees, denoting a negative resistance. This is the classic characteristic of all constant-power switching power supplies, and it is at the heart of the stability problem that can arise when coupling switching power supplies with input filters.
This closed-loop input impedance stays relatively constant until the impedance of the input filter capacitor becomes lower than the starting negative resistance. The impedance then follows the asymptote B, with a 90 degree phase delay, as observed for the open-loop characteristic.
Notice that there is not the same simple relationship between the open-loop and closed-loop input impedance and loop gain that exists for the audiosusceptibility and output impedance. For these two quantities, the open-loop characteristic was attenuated by 1+T(s). Input impedance is different. When there is significant loop gain, the input impedance is transformed into a fixed-value negative resistance. Without any input filter components, the input impedance rises with frequency after the crossover frequency. However, as can be seen in this example, the input impedance is heavily influenced by the present of the input filter capacitor.
Summary
This article discusses the significance of power supply input impedance, and shows how it can be practically measured. Most aerospace designs require a power supply input impedance measurement in order to properly assess the impact of integration of power supplies into larger systems. In most cases, input impedance measurements include the impedance of the input filter, and this complicates the proper application of Middlebrook’s impedance interaction criteria. [3].
References
- Ridley Engineering Frequency Response Analyzer from AP Instruments, www.ridleyengineering.com/index.php/analyzer.html
- Ridley Engineering Design Center, www.ridleyengineering.com/index.php/design-center.html
- “Power Supply Design. Volume 1: Control�, by Dr. Raymond B. Ridley. Full-color textbook available a http://www.ridleyengineering.com/index.php/books.html