Knowing Battery Charge and Health Data in Real-time
In our electrified world, we have become accustomed to continuity. If an airline scheduling system goes down due to a power outage or our electric vehicle runs out of charge unexpectedly, we’re outraged. Battery systems providing backup and motive power should have guaranteed availability; but how is this ensured and measured?
Perhaps we’ve been spoilt by the apparent robustness of our traditional lead-acid car batteries. It’s not unusual for them to last more than ten years with no fancy health monitoring or charge control. However, occasional peak current to crank an engine followed by regular continuous float charging from an alternator is quite a benign situation. Batteries that stay inactive for long periods on standby, or which have to regularly discharge deeply, are in another category. Monitoring and control of their charge and discharge cycles is vital for longest service life and knowledge of state of charge. Knowing their ability to deliver that charge at a certain time is a measure of state of health and is equally important.
Lead-acid and Li-ion are similar in some ways
Lead-acid cells are a good example. To get optimum performance, the cells should always be fully recharged after every discharge with a limited current initially then a ‘saturation’ charge at fixed voltage between 2.3 and 2.45 V/cell. This is followed by a ‘float’ charge between 2.25 and 2.27 V/cell depending on temperature. During the saturation phase, the current eventually drops to about 3 -5% of the amps in the amp-hour rating, at which point the battery is fully charged. The float charging then makes up for the significant self-discharge of the battery. The saturation charge voltage is quite critical: too low and maximum capacity is not reached and there is a risk of sulfation on the negative electrode; too high and internal corrosion occurs with gassing and water loss. All these effects depend on temperature with the optimum charge voltage varying by 3 mV/oC, reducing above 25oC, and increasing below.
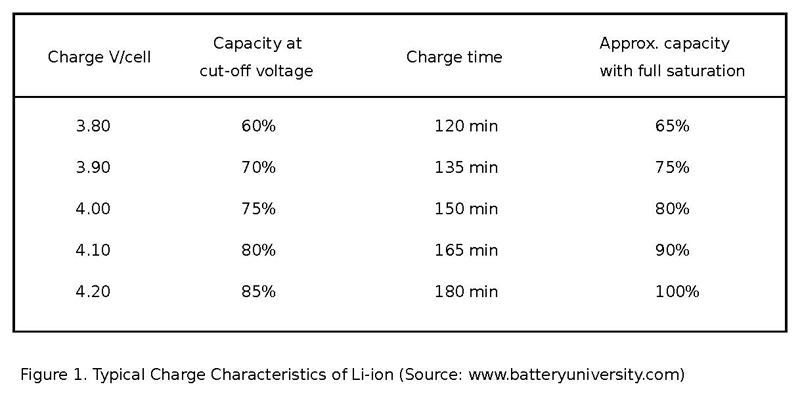
Lithium-ion cells are similar to lead-acid in some ways: they are charged at constant current until the terminal voltage reaches typically 4.2 V. There is only about 50 mV tolerance to this figure and it must not be exceeded otherwise catastrophic failure can occur. It is so critical that lithium-ion cells have built-in protection electronics to limit the voltage. Unlike lead-acid, Li-ion cells are not float charged: this would cause plating of metallic lithium so the charge current is terminated when it subsides to about 3 to 5% of the cell amp-hour rating. There is some small self-discharge over long periods in part because of the built-in protective circuit but this is countered with brief ‘topping up’ cycles. Also, unlike lead-acid, it is not necessary or even desirable to take Li-ion to full charge. Using the maximum allowable voltage applies stress while aiming for a lower voltage extends cell life but at the expense of run time. See Figure 1. Industrial and critical applications will take the reduced stress route while consumer products are more focussed on run time.
An intelligent battery charger will take into account all of the critical conditions to get maximum life and run-time from a battery. The most comprehensive systems for Li-ion automotive applications might have eight or more controlled charging stages in a programmable profile with sensors monitoring voltage, current and ambient and cell casing temperatures to apply the appropriate corrections.
‘Batteries have complex personalities’
Having worked to charge a battery in the most benign way, it is a different matter to measure its state of charge at any point. We have all watched in dismay as our cell-phone charge percentage goes from 50 to zero within minutes; so why is it so inaccurate?
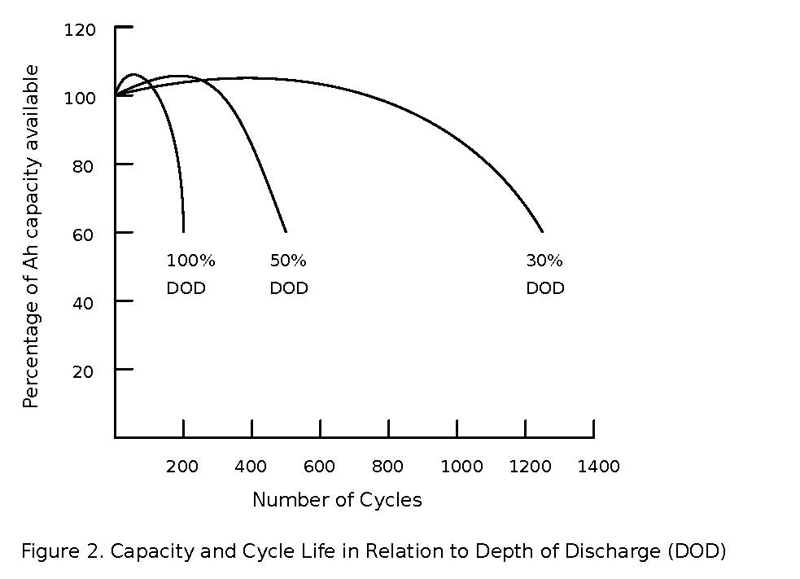
Batteries of all types have dynamic and complex personalities that depend on manufacturing tolerances, age and temperature and how they have been used or misused in the past. Cell voltages give a very poor indication of anything other than ‘empty’ or ‘about full’. And worse, after significant charge or discharge, cell voltages need a period of ‘relaxation’ of up to 24 hours to settle to a constant value. Even the definition of ‘fully charged’ has a different meaning over time, for example a lead-acid battery goes through a formatting process, actually increasing its amp-hour capacity at full charge over the first few hundred discharge cycles, peaking then eventually falling again depending on depth of discharge cycles. See Figure 2.
Click image to enlarge
Figure 2. Capacity and cycle life in relation to Depth of Discharge (DOD)
State of charge can be gauged in different ways. For ‘flooded’ lead-acid types, a sure way is to measure the specific gravity of the electrolyte but for sealed types this is not an option. Another possibility to measure state of charge is to cycle the battery to full discharge and then charge with a measured amount of energy. This can damage lead-acid cells but is viable, if slow, for other chemistries. This ‘coulomb counting’ can be accurate but being an integrating technique, it accumulates errors and has to be regularly re-calibrated.
For any battery, capacity at full charge also depends on temperature. For example, most battery types at -20oC have only around 50% of their 25oC amp-hour capacity.
State of charge is not state of health
Knowing cell voltage and temperature with perhaps ‘coulomb counting’ can give an idea of state of charge. State of health, or capacity at full charge, can be estimated from the internal resistance of the battery cells but is a relative measure. It has been seen that internal resistance of new lead-acid batteries can vary by eight per cent or more, so measurements have to be referred back to the ‘new’ value to be of use. With that knowledge, it can be said that a 25% increase in resistance might lead to an overall drop in capacity of 20% from new. The rate of capacity loss over time is approximately linear; for example, lead-acid capacity decreases at a rate of about 0.25% per month after the formatting period.
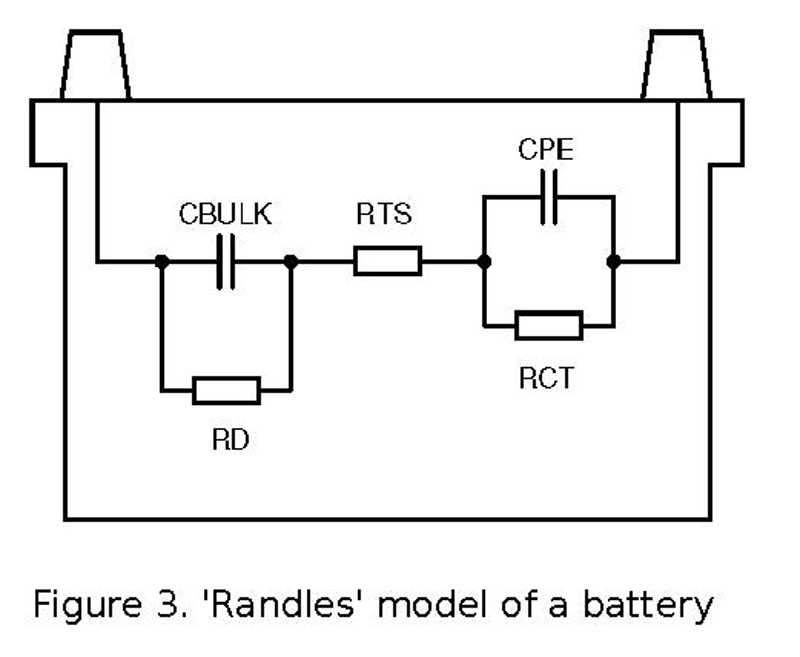
Measuring internal resistance can be done in more or less sophisticated ways. An equivalent circuit of a battery is given by the ‘Randles’ model, as shown in Figure 3.
Click image to enlarge
Figure 3. 'Randles' model of a battery
CBULK is the main energy storage, RD is the self-discharge resistance, RTS is the resistance of the electrolyte solution and mechanical connections, RCT is the polarisation resistance of the electrodes, and CPE is a surface capacitance of the electrodes.
RCT is a critical measurement for state of health but a simple DC resistance check by measuring voltage drop at two different currents only yields the combination of RCT and RTS. RTS has been shown to be a poor indicator of state of health, so a way to separate out the values is by injecting current at high frequency where CPE becomes low impedance, shorting RCT, leaving just RTS and by subtraction from the DC test, giving RCT.
An even more accurate measure is given by injecting a range of frequencies at low voltage and measuring resultant current amplitude and phase data - the Electrochemical Impedance Spectroscopy (EIS) method. Calibration over a range of batteries of different known ages builds up an accurate model, which can be used for both state of charge and state of health.
The future promises more exotic techniques still with non-invasive measurements such as magnetic susceptibility of the electrode material or even refractive index of the electrolyte giving indications of state of charge.
Knowledge is power
The ideal is to have charge and health data available in real-time, so communications is important. State-of-the-art battery management systems are smart and connected digitally. CAN bus, SPI bus, USB and wireless communications are increasingly used to give that all-important reassurance that you really do have those miles left ‘in the tank’.
Stadium Stontronics sells a range of intelligent battery chargers and can design and manufacture custom battery charging and monitoring systems.
Stadium Stontronics