In this article, Dr. Ridley describes how you can make frequency response measurements of transformers and inductors using equipment that you probably already have in your laboratory. This is very important for students and very small companies who cannot afford the sophisticated equipment needed for more serious production level work and for high-speed development.
The Importance of Impedance Measurements
While still a student at Boston University, I was fortunate to enroll in a machines class which was taught in the Franklin Institute. The course was very hands-on, involving ac motors, transformers, and generators, in a laboratory that had been in place for decades. To this day, I clearly remember many aspects of the lab due to the immediate and interactive nature of the experiments.
One of the first things that we did in the lab was to plot a transfer function of transformer and motor windings in order to extract important equivalent component values needed for design and analysis. This process was always a fundamental first step in doing any experimental work. The experiments were performed using basic laboratory equipment, using an analog signal generator and analog oscilloscope.
Once I started work in power supply design, I applied the same philosophy when building hardware. All magnetics should be properly characterized over a wide range of frequencies in order to extract important parameters. During the design phase, these parameters are very important. Later on, during the transition from design to manufacturing, the characteristic frequency response curves are a powerful and sensitive tool to determine proper construction of magnetics.
Ideally, the measurements of magnetics impedance should be made with a properly calibrated and automated piece of test equipment [1]. However, many students of power electronics, and engineers just starting their careers or their own companies do not have access to anything but the most basic of laboratory instruments. Even in this situation, it is highly recommended that the impedances of magnetics be properly measured and recorded. It may be a time-consuming process, but it is very important for understanding of your circuit, and repeatability of design.
Manual Setup of Impedance Measurements
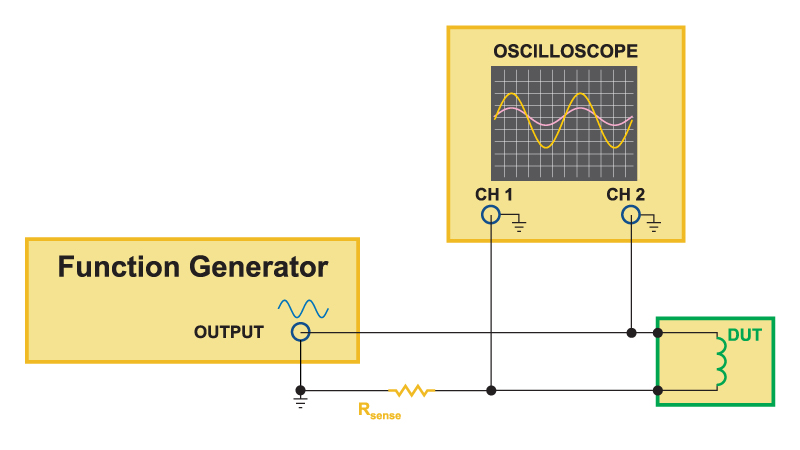
Figure 1 shows the recommended test setup for measuring magnetic components. The device under test is connected in series with a 1-ohm test resistor, and a signal applied across the series combination. The voltage across the 1-ohm resistor, representing the current, is measured with one channel of an oscilloscope, and the voltage across the series combination measured with the second channel.
Click image to enlarge
Fig. 1: Schematic of how to measure frequency response of magnetics using a signal generator and oscilloscope.
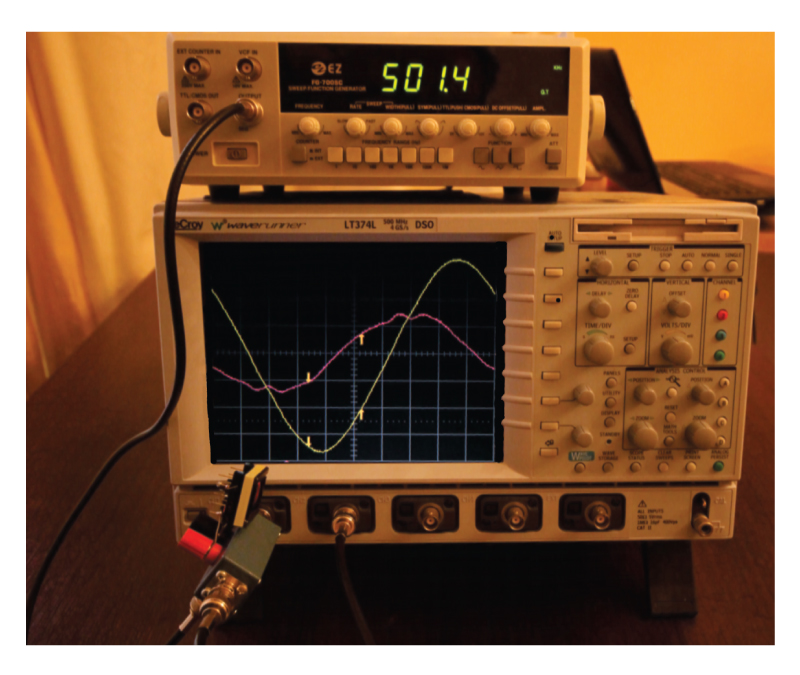
Figure 2 shows a photograph of the actual lab test setup. A small test fixture containing the sense resistor was used to improve RF layout issues of the test setup.
Click image to enlarge
Fig. 2: Photograph of manual magnetics impedance test setup.
I always recommend people with limited budgets use this test setup, but it is actually an experiment that I have not done for over 25 years. I have to admit that I encountered some surprises when revisiting this technique in preparation for this article:
- Modern signal generators are not as clean as the older pure analog signal generators. Switching techniques generate noise and distortion, especially at higher frequencies. The effect of this can be seen in the waveforms of Figure 2 where high-frequency resonant harmonics are excited.
- Modern low-cost oscilloscopes do not do a good job of rejecting high-frequency noise, and the noise floor is quite high. The 20 MHz bandwidth limiting function does not work as effectively as it should. The oscilloscope used in Figure 2 is a high-quality instrument from LeCroy, necessary for good noise performance.
- Switching power supply noise is EVERYWHERE in today’s world, and it will show up in your measurements. Most bench equipment includes switching power supplies, and these are filtered with varying degrees of success. Computer adaptor and power supplies also contribute to this noise.
- It takes longer that I ever remembered to make hand measurements. An average of around 4 minutes per data point was needed when phase data was also recorded, and more time was needed with distorted waveforms.
Experimental Results with Manual Impedance Measurements
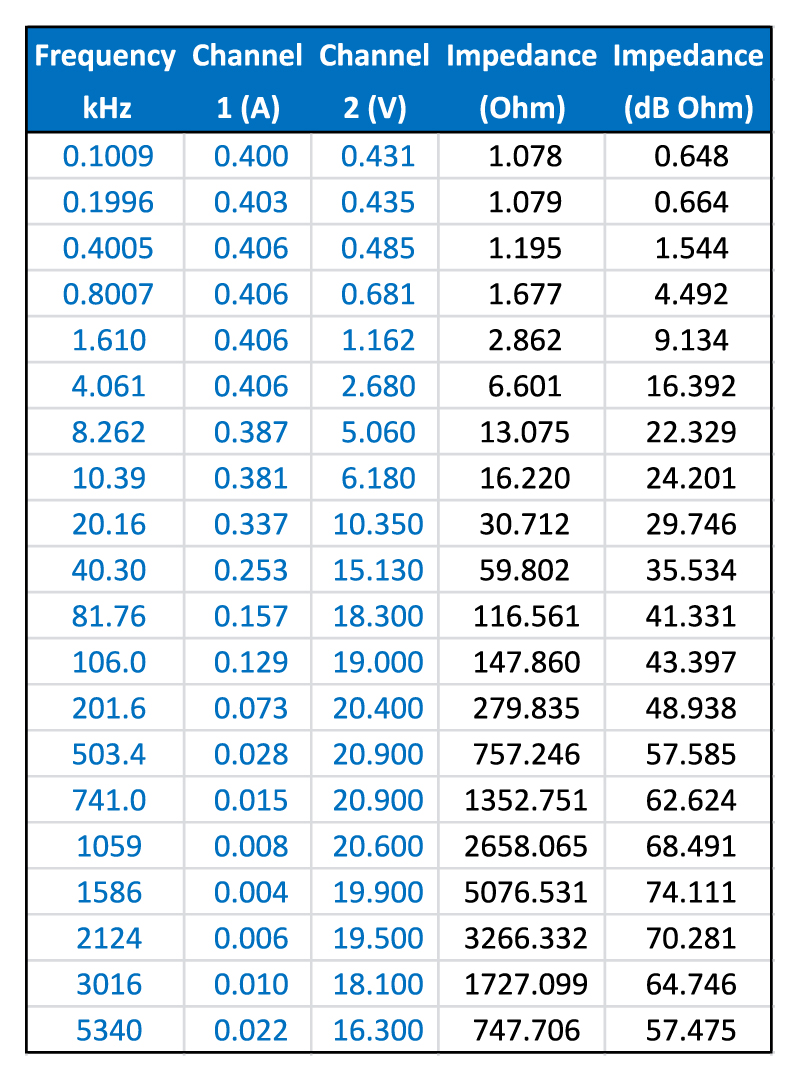
Data was collected for a sample forward converter transformer, and this data is shown in the Table of Figure 3.
Click image to enlarge
Fig. 3: Table of data collected with manual measurements.
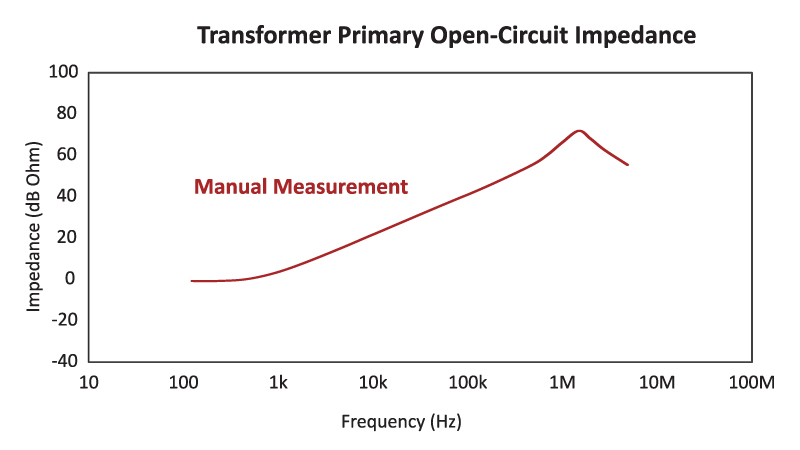
Figure 4 shows the plot of the impedance versus frequency. A smoothed curve chart was selected within Excel to plot this data. The total time required to collect the data and plot the points was approximately one hour. This did not include recording phase data.
Click image to enlarge
Fig. 4: Open-circuit manual impedance measurements of transformer.
Comparison of Manual and Automated Impedance Measurements
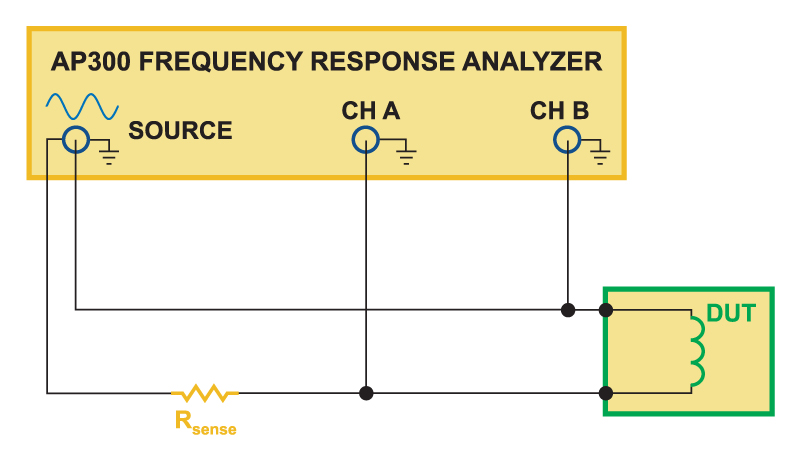
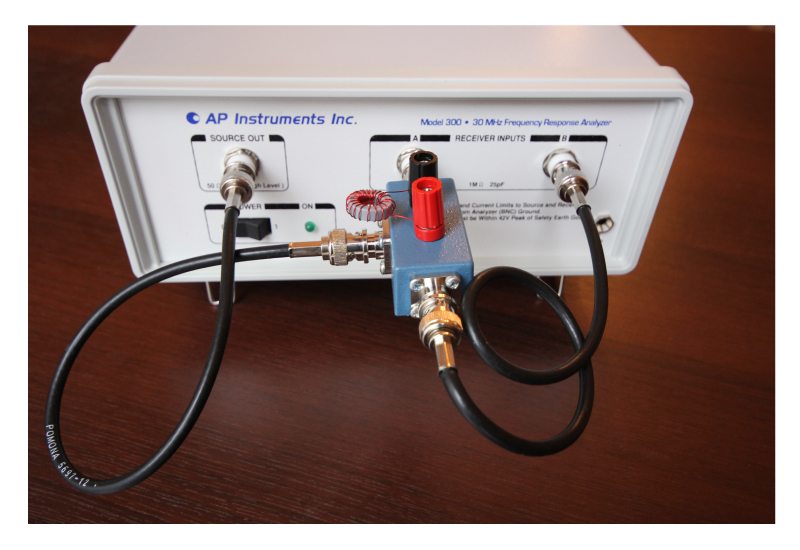
Figure 5 shows the automated test setup schematic using the AP300 Analyzer, and Figure 6 shows a photograph of the actual hardware used. The same impedance test fixture was used as for the manual measurements.
Click image to enlarge
Fig. 5: Schematic of test setup for measuring magnetics impedance with AP300 Analyzer.
Click image to enlarge
Fig. 6: Photograph of magnetics test setup with AP300 Analyzer.
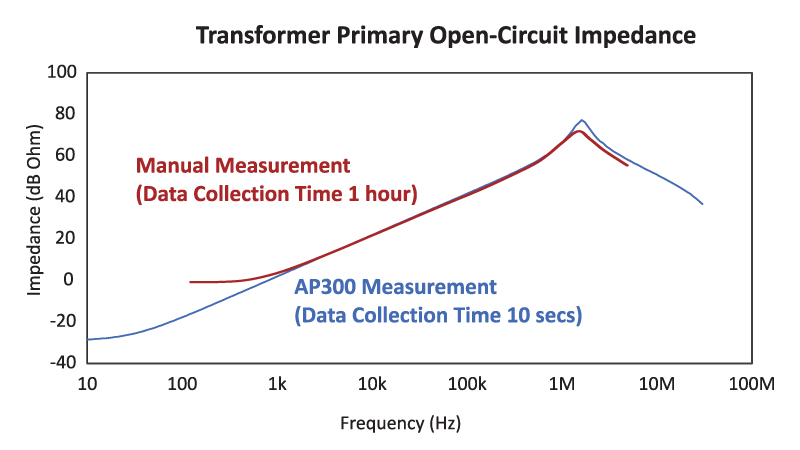
Figure 7 shows the plots of both the manual and automated measurements of the primary transformer impedance. At frequencies from 1 kHz to 5 MHz, the two techniques gave very good agreement, validating the usefulness of the manual approach. Resonant frequencies were very similar, with any difference attributable to calibration errors in the signal generator.
Click image top enlarge
Fig. 7: Comparison of manual transformer Open-Circuit impedance measurements and automated measurements with the AP300.
Below 1 kHz, the primary impedance dropped below 1 ohm. The raw data does not show how much of the impedance was due to the sense resistor, and how much due to the winding impedance. In order to extract this data, you can use a lower value sense resistor to extend the measurement range. Alternatively, you can collect phase data at each frequency point, then subtract the value of the sense resistor when post-processing the collected data values. This was not done for the curves of Figure 7.
The signal generator used had a maximum frequency of just 5 MHz, and a better piece of equipment is needed to extend the frequency range to see the full characteristics of the magnetics component.
While the data collected manually was very good, the big drawback of this technique was the amount of time needed to collect accurate data. It took over one hour to accurately measure and plot the data. The AP300 analyzer collects the same information, plus phase data, in under ten seconds. This time saving becomes very important when you are doing real production work. However, for university work, and initial experiments, the manual technique is very useful.
Manual and Automated Short-Circuit Impedance Measurements
Manual impedance measurements were also collected with the secondary of the forward transformer shorted. This greatly reduced the impedance level of the measurements, and created problems in getting accurate results. The biggest issue was with the distorted output of the signal generator when driving the low impedance of the shorted transformer.
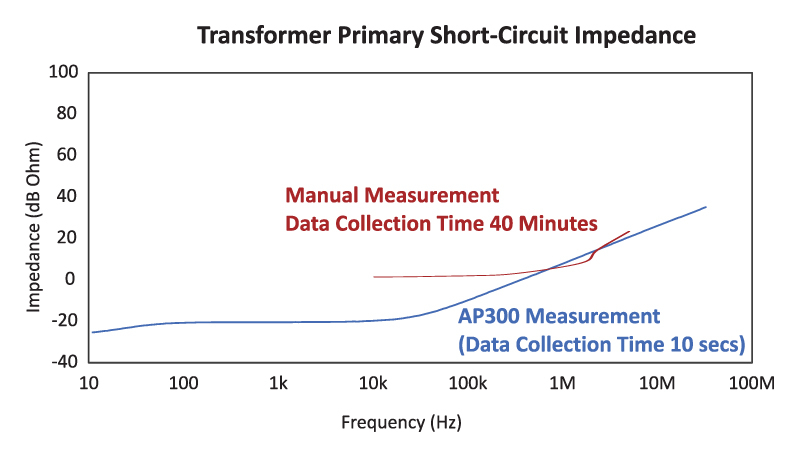
Figure 8 shows the results of both the manual and automated measurements with the secondary of the transformer shorted. The manual results were not nearly as good due to the difficulty in getting accurate measurements. It was very difficult to get accurate phase measurements with the distorted waveforms.
Click image to enlarge
Fig. 8: Comparison of manual transformer Short-Circuit impedance measurements and automated measurements with the AP300.
Improvements can be made with a better signal generator, and with a lower value sense resistor. Often you will find that older laboratory equipment will do a better job than some of the modern designs.
When measuring short-circuit impedances, phase information is much more important to collect since the leakage inductance parameter is a nonlinear element which changes with frequency. You cannot just look at the magnitude of the impedance curve and assume 90 degrees phase shift. Calculation of the leakage inductance at each frequency requires both gain and accurate phase information.
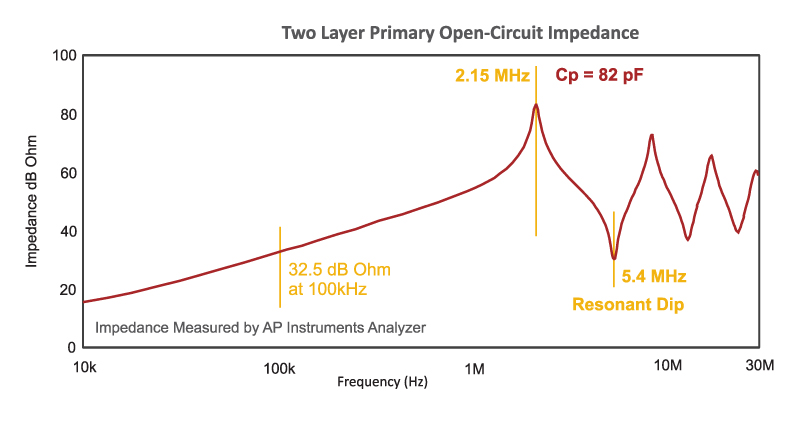
Only ten data points were collected for the manual measurements, and this took about 45 minutes. This is compared to just 10 seconds with the AP300 automated measurements. With more complex impedance curves, such as that shown in Figure 9, many more data points must be collected to completely record the full impedance characteristics of the magnetics. Manual measurements of such an impedance characteristic would take a couple of hours if you want to accurately reproduce the true characteristics of the device.
Click image to enlarge
Fig. 9: More complex flyback transformer primary impedance measurements.
While the impedance measurements require either time or budget for good equipment, they ultimately save you time and money in your project by guaranteeing that you have maintained consistency of manufacturing from one sample to another.
Summary
Magnetics impedance measurements should always be made for switching power supplies, whether you are a student, an engineer at a small company, or working for a large organization. If you cannot afford the proper automated test equipment, you should spend the time necessary to collect data manually with the techniques described in this article. The frequency response curves are an important record of your design process, and a good way to evaluate later design iterations of magnetics.
As you move to towards production and more serious design work, you will find that your time becomes more valuable, and more accurate equipment is needed to speed up your design process. At some point you will find that the manual data collection process takes more time than you can afford.
References
- Ridley Engineering Frequency Response analyzer from AP Instruments, www.ridleyengineering.com/index.php/analyzer.html
- Ridley Engineering Design Center, www.ridleyengineering.com/index.php/design-center.html