Optimizing Drive-Cycle Simulations for Automotive Applications
Optimizing Drive-Cycle Simulations for Automotive Applications with Wolfspeed Silicon Carbide
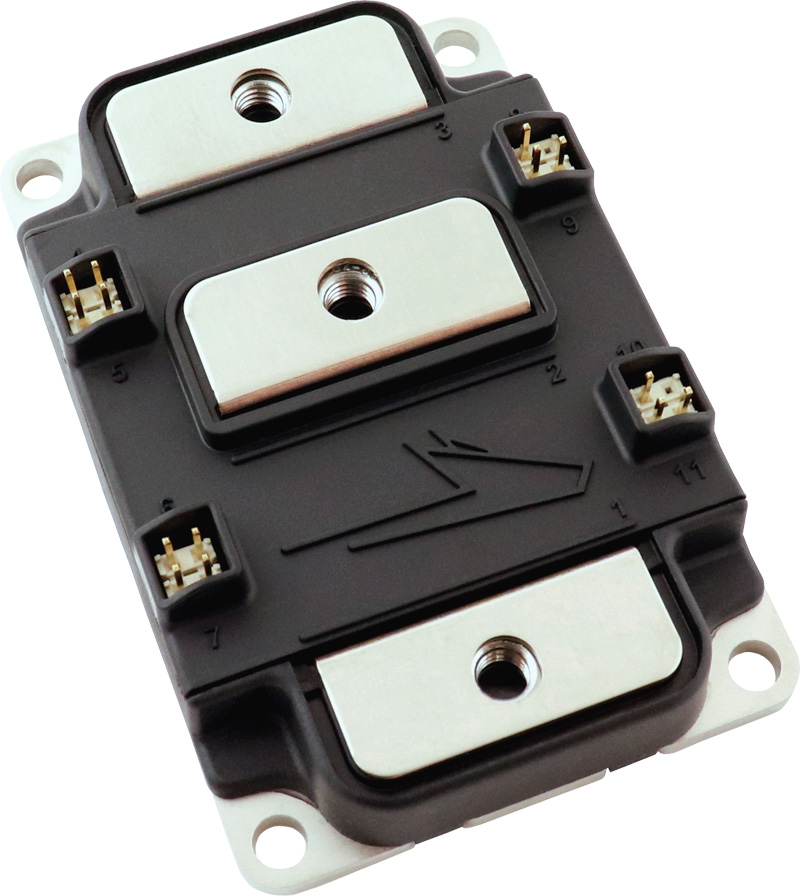
Figure 1. EAB450M12XM3 automotive qualified 1200 V, 450 A all-Silicon Carbide conduction-optimized, half-bridge module by Wolfspeed®
Silicon Carbide (SiC) has transformed power delivery and management in a number of industries, especially electric vehicle (EV) charging and on-board power conversion. This is due to its superior thermal characteristics, low losses, and power density, which result in higher efficiency and reliability when compared to more traditional technologies such as silicon (Si) insulated-gate bipolar transistors (IGBTs). To get maximum system efficiency and predict performance accurately, it’s important to fully simulate and characterize the topologies, systems, and applications that use these SiC components.
The EAB450M12XM3 by Wolfspeed is an automotive-qualified SiC power module that has been optimized for the traction inverter market and although it has many benefits, the designer must simulate as much of the system as possible to take full advantage of them. When simulating traction inverters for EV applications, designers must find a balance between complexity, accuracy, and simulation time. This article will explore how to develop a model suitable for simulating inverters in automotive drive cycles where these traction applications can leverage the advantages of SiC.
Device- and Module-Level Performance
There are many ways to simulate a SiC traction inverter, but let’s break it down into four levels of abstraction.
1. Simulating the semiconductor component itself (device-level) is core to successfully predicting the system performance.
2. Simulations of the assembly or package containing the device (module-level) typically capture electro, thermal, and machinal implications.
3. Simulating the system that uses these sub-assemblies (system-level) maps the overall drive cycle to electrical requirements.
4. Simulating the system in application (application-level) allows understanding the performance in a particular use case (such as a drive cycle).
The EAB450M12XM3 (shown in Figure 1) offers many device- and module-level features that reduce switching loss while providing key benefits, such as temperature feedback and voltage sensing/over-current detection. The device also comes in an easy-to-integrate footprint with optimized thermal management, low internal inductance (6.7nH) and a low-inductance busbar connection, and much higher-power density (60% smaller volume and 55% smaller footprint) when compared to industry-standard packages.
And while the EAB450M12XM3 offers high performance, it also falls within Wolfspeed’s portfolio of automotive-qualified parts, where certain devices have been optimized for and proven robust enough for automotive applications. Additionally, selecting Wolfspeed components has some added benefits for the designer:
1. We offer comprehensive power electronics modelling.
2. Ability to create averaged models with thermal analysis.
3. Ability to conduct a complete drive-cycle analysis in PLECS.
4. Ability to model the effect of inverter performance on EV range and battery cost.
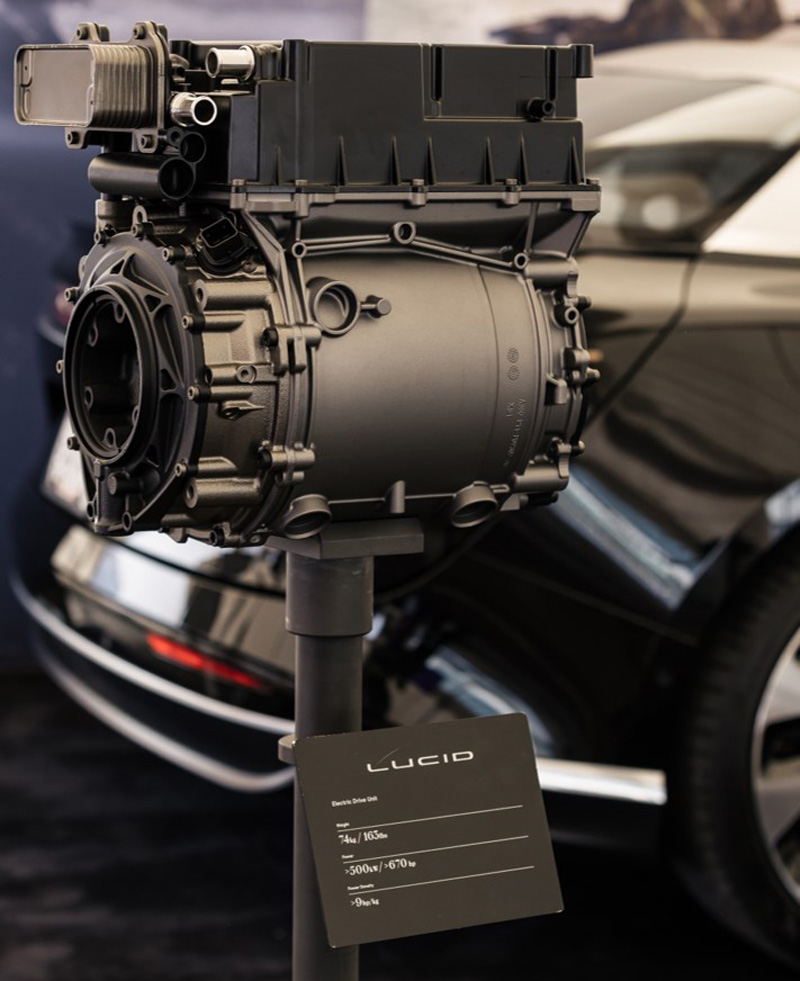
The Lucid Air’s XM3 traction drive (shown in Figure 2 which utilizes the EAB450M12XM3) has achieved a weight of 74kg, power of 670+ hp, and power density of more than 9hp/kg. These specifications have allowed the Lucid Air to take home an award for MotorTrend Car of the Year (2022).
And finally, a 600 kW XM3 dual inverter reference platform (Figure 2) is available to help designers prototype drivetrains quickly and with confidence. This reference platform offers major power density and efficiency throughout the full power spectrum (200-600kW).
Click image to enlarge
Click image to enlarge
Figure 2a. Lucid Air’s XM3 traction drive and Wolfspeed’s XM3 dual inverter reference platform
System-Level Simulations and Tools
Wolfspeed uses three primary tools for simulating power modules: PLECS, SPICE, and FEA.
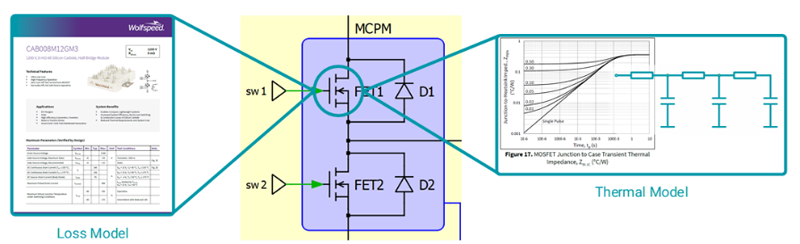
Piecewise Linear Electrical Circuit Simulation (PLECS) allows for modelling and simulating complete power electronics systems, including the source, conversion, and loads. In addition to electronics, it also assists with modelling the physical domain such as thermal, magnetic, and mechanical, providing a full system-level evaluation. It helps to drive device selection at the component level, and, although it comes with many helpful features, it can over-simplify certain aspects such as switching events in the electrical domain. For an inverter application, it can model a system using parameters from a datasheet and determine conduction and switching losses, while also providing a thermal model of the junction-to-case transient impedance (see Figure 3).
Click image to enlarge
Figure 3. Example of PLECS model for loss and thermal simulation
Simulation Program with Integrated Circuit Emphasis (SPICE) is a commonly used, open-source circuit simulator that can be used to predict circuit behavior in the analog domain. This helps with the inverter application by characterizing dynamic current sharing between parallel devices and helping to optimize mismatches and current unbalance. Additionally, it allows for Monte Carlo simulations and EMC analysis. While it’s a standard platform with many possible use-cases, it can be heavily influenced by the circuit, such as gate drive characteristics and parasitics, and lead the designer down the wrong design path with misleading parameters.
Click image to enlarge
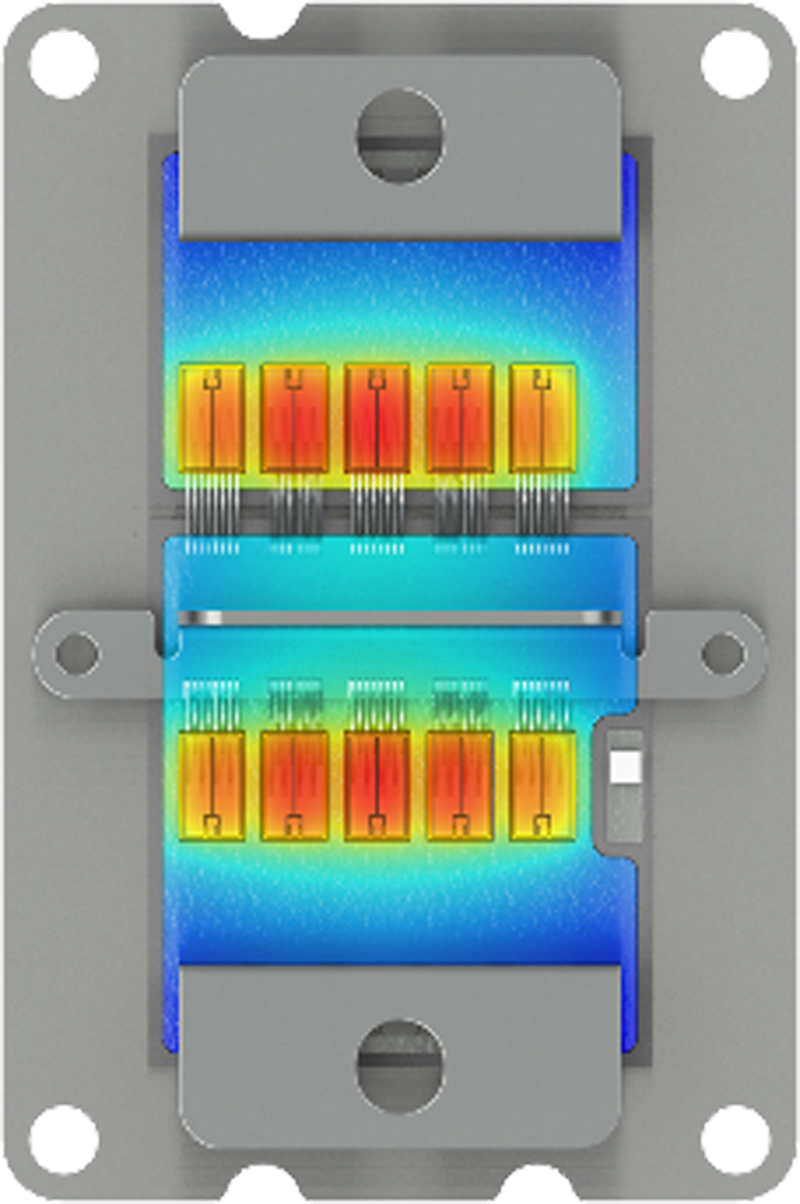
Figure 4. Example of FEA Simulation, EAB450M12XM3 Thermal Analysis
Finite Element Analysis (FEA) is used to break down a shape or structure into many smaller elements that are subjected to calculations related to real-world forces, such as heat, vibration, stress/strain, and other environmental and physical effects. On the module level, it can enable designers to estimate RTH, inductance, ampacity, and determine inter-die interactions (See Figure 4). However, it usually comes at a high price (cost-wise) and requires very detailed inputs and CAD models. It also takes the longest to simulate compared to PLECS and SPICE.
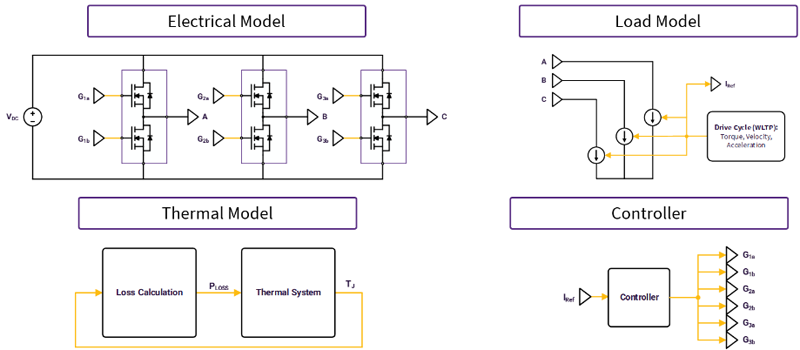
Using any or all these simulation platforms can help to optimize efficiency, losses, and thermal management. For instance, modelling the switching characteristics of a SiC half-bridge module helps with predicting switch-voltage waveforms and determining ripple, particularly at the load. Power loss and on/off energy can be calculated using 2D and 3D lookup tables (using parameters such as VDC, IAM1, TJ and RG). PLECS can also model the half-bridge’s thermal characteristics by taking these simulated power losses and inserting them into a Cauer Model with a couple other parameters such as RTH and TFLUID. And once the load and controller are modelled, the designer can then have a full system design to help optimize device selection, topologies, thermal management, efficiency, and control methodology. Figure 5 shows the general flow of a full system-level simulation. For drive cycle simulations, the load model critical component. In this simulation, the load was simulated as a current source which followed the drive cycle profile.
Click image to enlarge
Figure 5. Full-system simulation with electrical, thermal, load, and controller
In order to build such system models, characteristics of the power module must be known, either from testing or from the datasheet. Alternatively, Wolfspeed offers downloadable PLECS models for its entire portfolio.
Once the electrical, loss, and thermal models are determined, they can then be used to run a full vehicle simulation, including a Worldwide-Harmonized Light Vehicles Test Procedure (WLTP) drive-cycle test with the appropriate electrical operating conditions.
Inverter Performance and Drive-Cycle Simulation
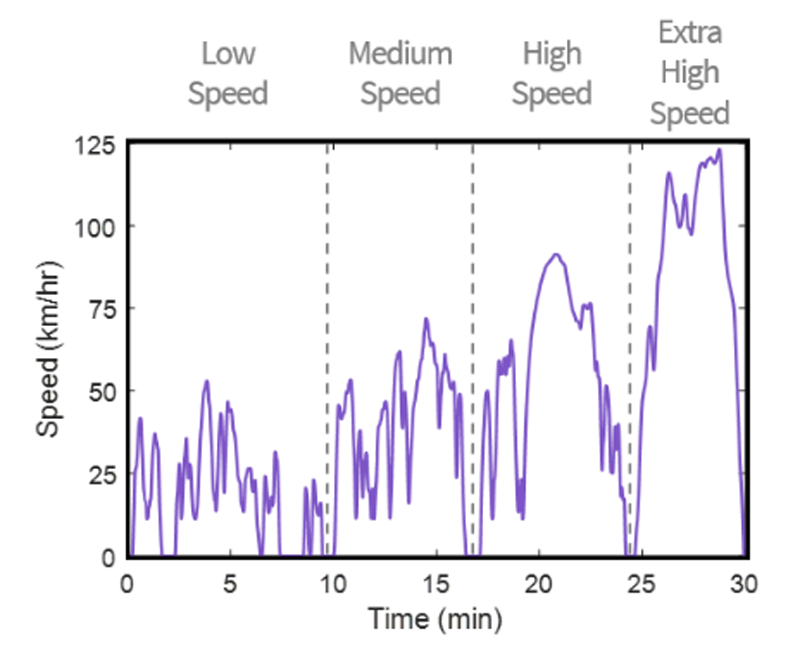
At this point, we’ve touched on three of the four tiers of simulation: device, module, and system levels. These are all required to establish a core understanding and expectancy of system-level behavior during a drive cycle. While the electrical operating points, thermal/electrical characteristics, and loss calculations and models can be handled on the Wolfspeed side, the Worldwide-harmonized Light-duty Test Cycle (WLTC) (sample plot shown in Figure 6) will dictate torque, velocity, acceleration, and the working points for these parameters.
Click image to enlarge
Figure 6. WLTC plot
Let’s break down the WLTP so we can understand how it impacts the underlying electronics.
The mean, or average WLTP condition, typically results in 95% of the energy loss due to switching. This is what typically drives vehicle range improvements and only utilizes 10% (or less) available thermal performance.
The max IOUT, or peak WLTP condition, will generate the maximum operational change in temperature but may still only use 30% available thermal performance.
The peak current for 30 seconds, or peak sizing condition, is not typically encountered during normal operating conditions but may drive specific cooling requirements for the SiC area, driving inverter cost, volume, and lowering efficiency.
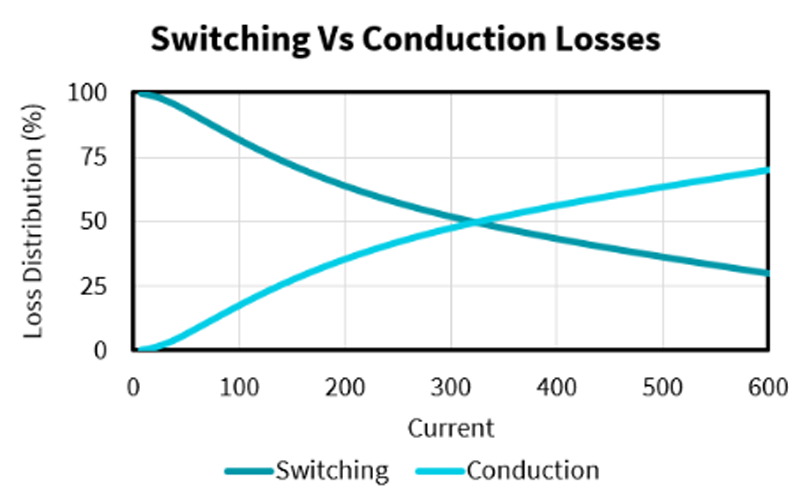
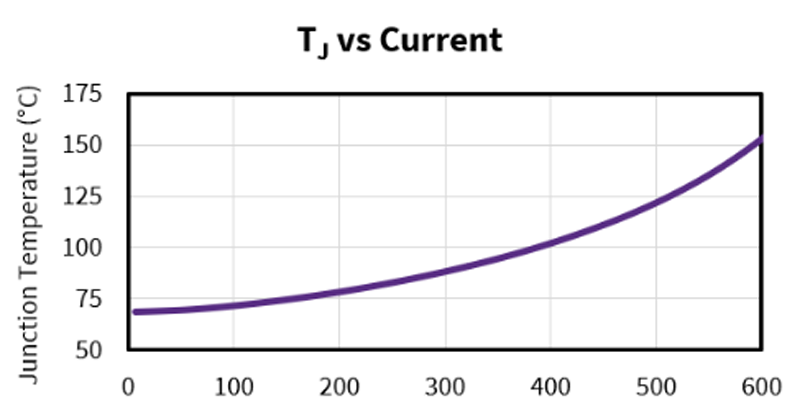
Understanding the WLTP profile and how it may demand system current can help designers plan for losses upfront and optimize the system configuration. Figure 7 shows how lower currents in a module drive switching losses while higher currents are dominated by conduction losses. Another plot in the figure describes how junction temperature of the module typically increases with current.
Click image to enlarge
Click image to enlarge
Figure 7a. Current vs. losses (Figure 7a) and current vs. junction temperature (Figure 7b) for a module
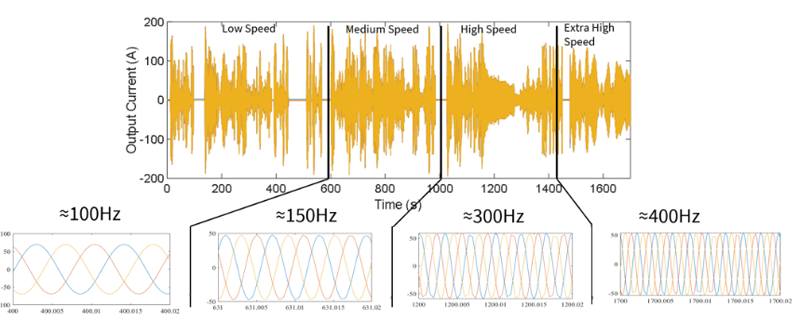
Figure 8 shows how the WLTP drive-cycle speeds relate to an inverter’s phase current.
Click image to enlarge
Figure 8. Inverter current waveform over WLTP drive cycle
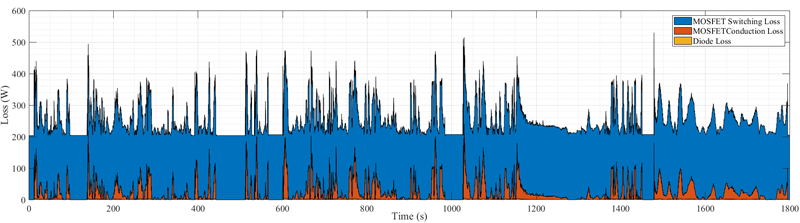
If we take the plot above and correlate the currents shown with conversion power loss, we see that switching losses are much higher than conduction losses (while diode losses are negligible) over the WLTP drive cycle. See Figure 9 below.
Click image to enlarge
Figure 9. Converter power loss over WLTP cycle
Taking this same WLTP drive cycle and translating it to junction temperature allows designers to understand cooling requirements and even make predictions with regards to reliability and product lifetime.
One more thing that can be derived from this WLTP drive-cycle simulation is a comparison of switching energy losses over time due to the choice of external gate resistor. Lower values of RG(EXT) (in combination with high loop inductance) may result in voltage overshoot and high values of dv/dt and di/dt. This can cause module failures and can even delaminate motor windings. However, choosing a lower RG(EXT) can reduce overall energy loss throughout a drive cycle, translating into savings for the customer and a longer battery range. This is another example of how understanding the drive cycle and simulating it upfront can help guide the designer with device/component selection and optimizing inverter design while keeping in mind the customer’s interests.
Summary
To summarize, it’s important to simulate not only the underlying sub-systems and system-level configurations, but also the application (drive cycle) as it helps build a core understanding on the real usage of the system. Optimizing modules (like the EAB450M12XM3) and inverters to leverage SiC-based advantages such as efficiency, switching speed/loss, and thermal characteristics throughout the drive cycle can result in a longer-lasting product. Wolfspeed’s dual inverter application and eval kit can help get the designer to market much quicker — and with confidence.
Please visit wolfspeed.com/power-modules for more information and access to data sheets, application notes and other design support tools and resources.