In this series of articles, Dr. Ridley discusses the four important frequency-response measurements to be made during full characterization of a switching power supply. The important relationships between loop gain and output impedance measurements are highlighted in this first article. If you want to ensure a rugged and reliable design, both of these parameters must be directly measured.
Power Supply Transfer Function Measurements
There are four fundamental transfer functions that characterize the small-signal performance of a switching power supply. They are as follows:
1. Loop gain and phase– determines the stability of your design, and available margin to accommodate variations in components.
2. Output impedance– determines the output regulation, dynamic load response, and susceptibility to complex loading.
3. Audiosusceptibility– determines the transmission of noise from input to output.
4. Input impedance– determines the sensitivity of the power system to input filter or input power system components.
These parameters are listed in the order in which they are commonly measured and used in the industry.
A direct loop gainmeasurement is essential to guarantee stability of a power supply design over the lifetime of its usage in the field. Most reliable power supply designs include loop gain measurements as part of the design verification process.
If loop gain is the only parameter that is measured, there can be a tendency to focus too much on the stability at the expense of better closed-loop performance.More experienced designers include an output impedancemeasurement as part of their design verification and documentation, even if it is not directly required by the end customer. The output impedance measurement contains a wealth of information about how the converter will respond to dynamic load changes at different frequencies. It also provides information about the susceptibility of the power supply to complex loads. This allows a designer to predict with confidence how a converter will work when presented with different load scenarios.
An audiosusceptibilitymeasurement gives information on the transmission of noise from the input of the power supply through to the output. It is usually a requirement of the documentation package in the aerospace industry. This measurement is more difficult to make since a perturbation must be injected on top of the high-power input rail. Most commercial designs omit this measurement.
A measurement of input impedanceis also usually required by the aerospace industry. It is very useful for anyone designing large and complex power systems. As with audiosusceptibility, this is a more difficult measurement to make, but once injection is set up for the audiosusceptibility measurement, it is easy to measure the input impedance. (Note: most systems designers that perform an input impedance measurement do not apply the results properly, and this is an advanced topic discussed in a later articlein this series.)
Output Impedance Measurements
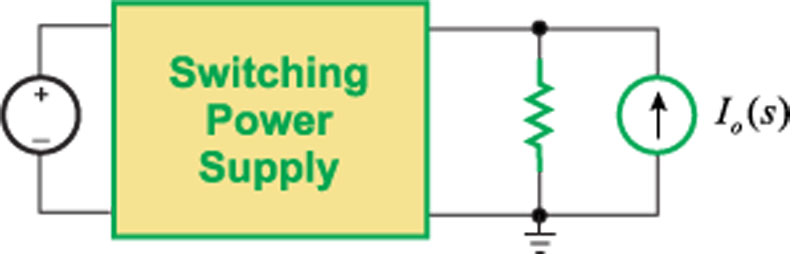
While loop gain measurements are essential for showing the stability of a power supply, it is the output impedance that directly shows how well a converter will regulate and how it will respond to changing loads. In order to measure output impedance, current must be injected into the output of the power supply as shown in Figure 1.
Click image to enlarge
Fig. 1: Output impedance is measured by driving a current into the output terminals of a power supply
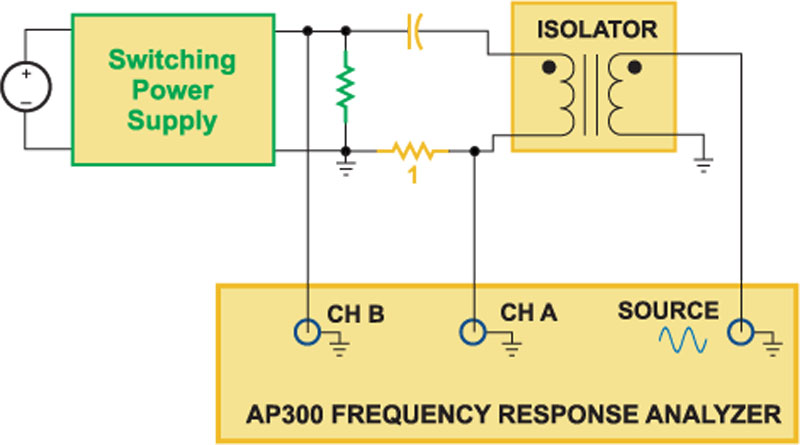
Figure 2 shows how this is implemented practically using a frequency response analyzer. Good results are obtained with this measurement setup up to about 100 W power, and alternative injection approaches can be used for higher power levels [1].
Click image to enlarge
Fig. 2: Practical test setup for injecting current and measuring impedance.
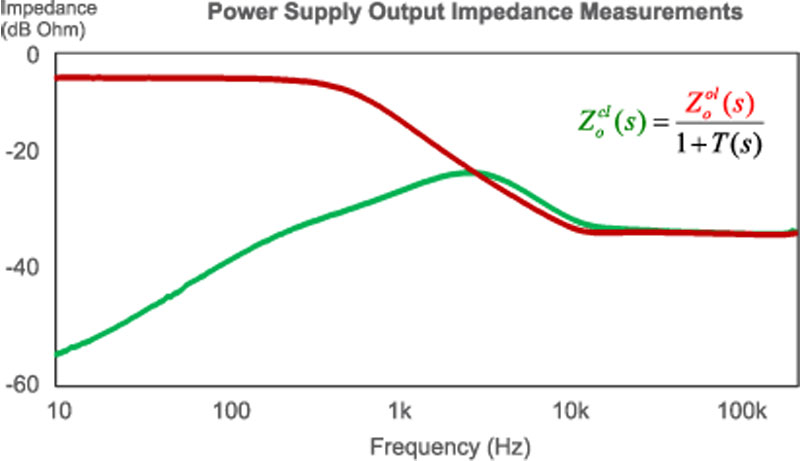
You should always plot both the open-loop and closed-loop output impedance to show how well your control design is implemented. These two measurements are shown in Figure 3 for a flyback converter.
Click image to enlarge
Fig. 3: Open-loop and closed-loop output impedance of a flyback converter.
The green curve of Fig. 3 shows the open-loop output impedance of the converter. At low frequencies, the dc level is set by the parasitic resistances of the power circuit, including the magnetics winding resistances and FET resistance. Above 1 kHz, beyond the resonant frequency, the measured impedance tracks the impedance of the output capacitor, flattening out with its ESR value at about 15 kHz. Great care must be taken with connection of the test cables to ensure that parasitic resistance and inductance is minimized during this measurement.
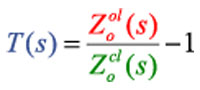
The red curve of Fig. 3 shows the effect of closing the loop on the output impedance. At low frequencies, where the loop gain is high, the output impedance is greatly reduced. The two curves converge together at the crossover frequency of the loop. As is well known, the theoretical closed-loop output impedance is related to the open-loop output impedance by the equation:
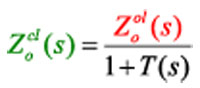
From this equation we can see that the higher the loop gain T(s), the more the output impedance is reduced by the feedback loop. When you are designing a power supply, there are two ways to reduce the output impedance and hence improve transient load response. The first is by increasing the amount of capacitance on the output of the power supply to lower the open-loop impedance. This, of course, requires more expense in terms of parts and space. Or, you can increase the gain of the loop. Changing loop components is usually a zero-cost option, but you must be careful not to increase the loop gain too high or instability can result.
Loop Gain Measurements
You should always measure the loop gain of your converter to ensure you are maximizing the performance in terms of output impedance whilst retaining rugged stability. Fig. 4 shows the test setup for injecting into the feedback loop for accurate results. This setup requires the insertion of a test resistor into the feedback loop, but this is not a difficult process. Further details of using this test setup are covered in detail in [1,2].
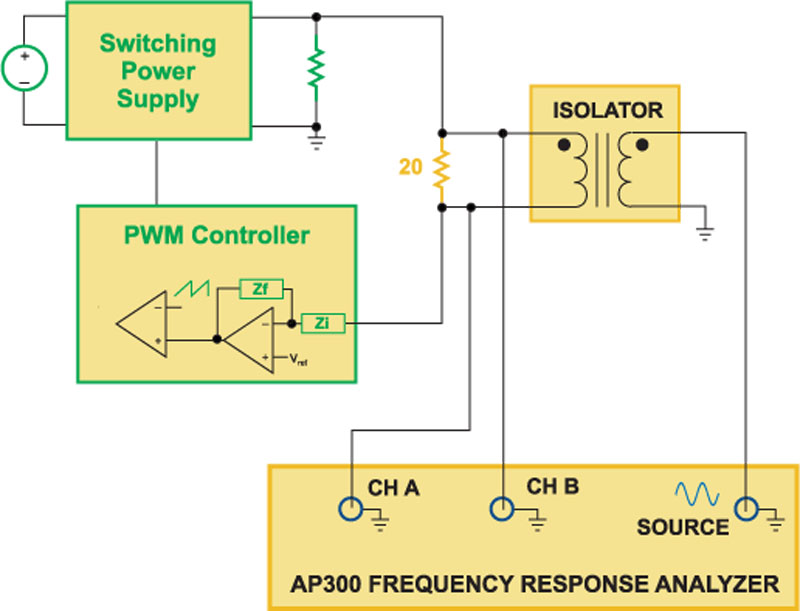
Click image to enlarge
Fig. 4: Measurement technique for loop gain.
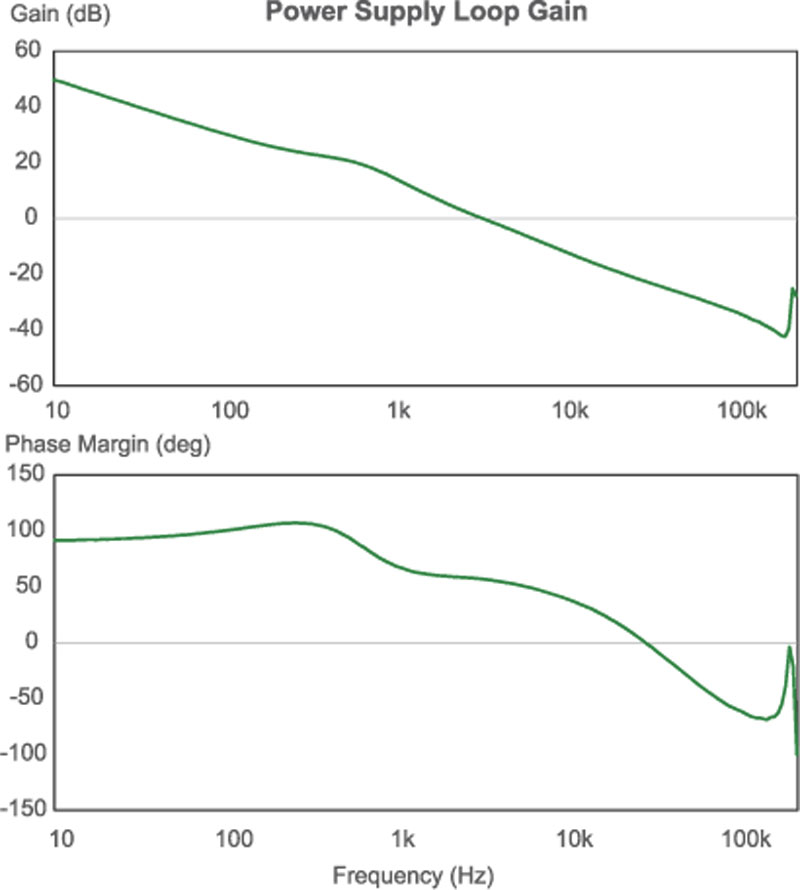
Fig. 5 shows the measured loop results for the flyback converter. The gain at 10 Hz is approximately 50 dB, and this corresponds to the difference in magnitude of the open- and closed-loop output impedances shown in Fig. 3.
The crossover frequency is at around 3 kHz, and the phase margin at crossover is 60 degrees. The open and closed-loop output impedances are approximately equal at this point. It is interesting to see that beyond this frequency, the closed-loop output impedance is actually higher than the open-loop measurement. This is because the vector sum of 1+T(s) is less than one as the phase margin of the measured loop drops below 60 degrees.
Clcik image to enlarge
Fig. 5: Direct loop gain measurement of flyback converter.
Synthesized Loop Gain Measurements
Three measurements have been made so far for this converter – open-loop output impedance, closed-loop output impedance, and loop gain. In theory, only two of these measurements should be necessary since the three quantities are related to each other by Eq. 1. In practice, however, we always measure all three quantities since direct measurement of each gives the most dependable results. This will be illustrated below.
If we rearrange Eq. 1, we can express the loop gain of the converter in terms of the impedance measurements as follows:
From this, we can try to plot the loop gain from just the impedance measurements. Note that it is crucial that both the magnitude and phase of the impedances are measured in order to perform this calculation, even though we commonly only present the magnitude as part of a power supply characterization.
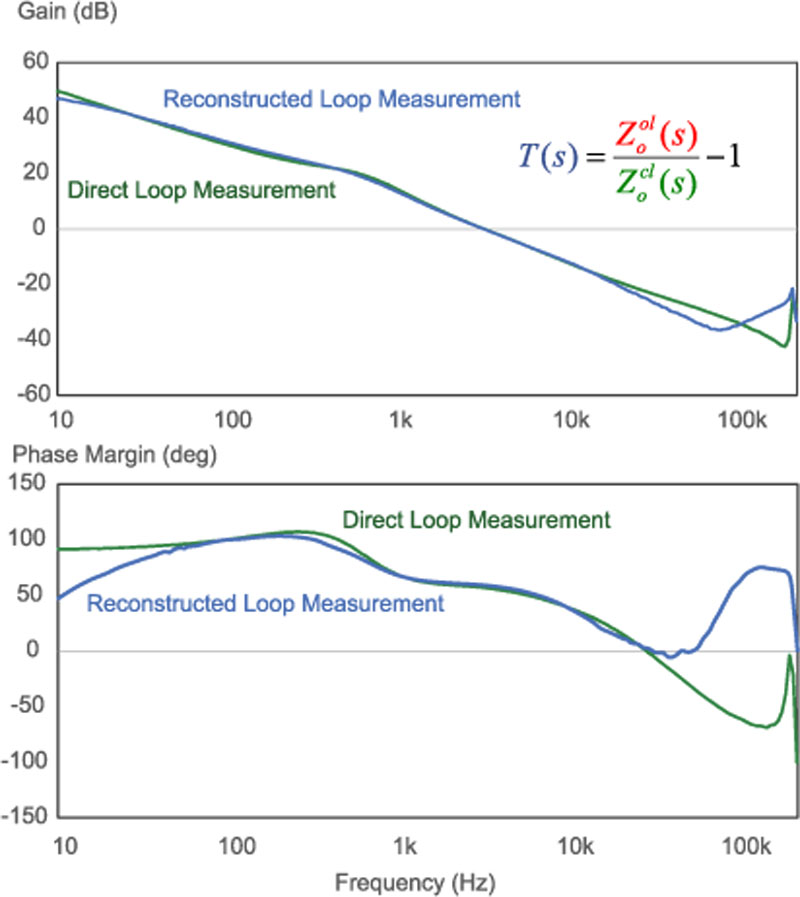
Fig. 6 shows the result of this equation plotted against the directly-measured loop. The green curve of Fig. 6 shows the real loop gain, and the blue curve shows the calculated loop gain, synthesized from the impedance measurements.
Click image to enlarge
Fig. 6: Direct loop gain measurement compared with synthesized loop from impedance measurements.
For this power supply example, the measured and calculated loop gains agree fairly well in the region of the crossover frequency. At high and low frequencies, there is very significant deviation of the directly-measured true loop gain, and the gain synthesized from the output impedance measurements. At low frequencies, parasitic resistance of connections an impact the lowest-measurable impedance, and give false readings.
At high frequencies, Eq. 2 becomes numerically inaccurate, and small errors in the impedance measurements result in large errors in the calculated loop gain and phase. This is illustrated further in Fig. 7 where a small change is made in the measurement setup by just moving test cables. Additional EMI picked up from the layout change of the instrumentation results in a very large change in the calculated loop gain and phase.
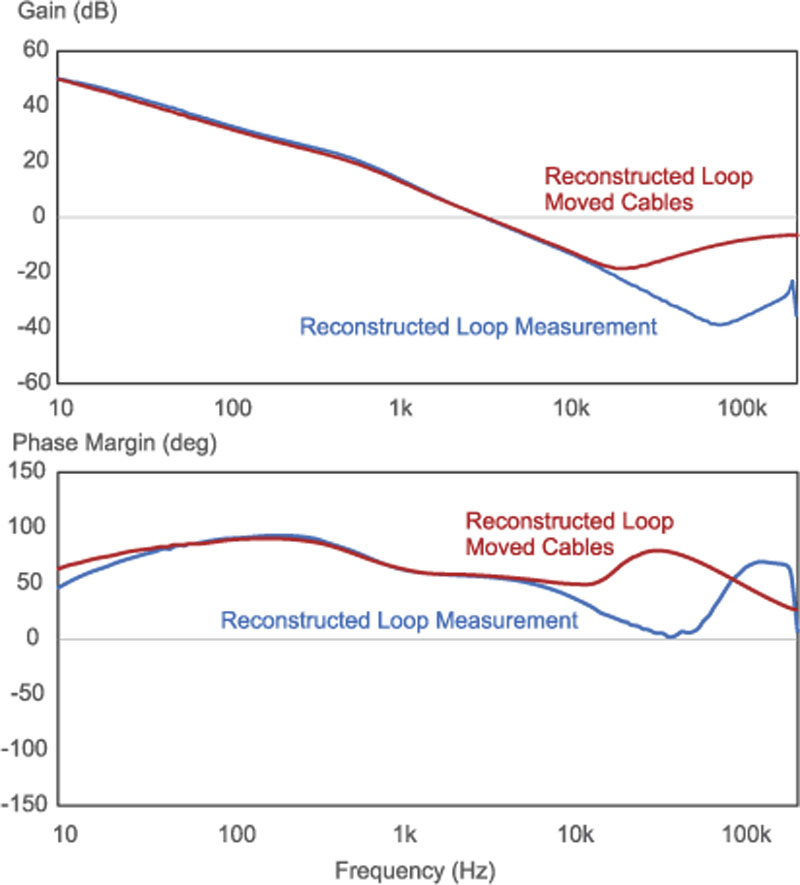
Click image to enlarge
Fig. 7: Different synthesized loops result with small changes in test setup. Loop gains should always be directly measured for the most reliable results.
Clearly, this kind of sensitivity is not acceptable when trying to properly characterize power supplies for their long-term stability. This is the reason that we always make the complete set of measurements. The direct loop gain gives the most rugged measurement that is not nearly as sensitive to noise issues and cable layout.
In this example, the calculated loop gain and phase at the crossover frequency was quite good. However, this is not always the case – in many real-world power supplies, the introduction of the feedback loop does more than just attenuate the open-loop output impedance. It also modifies the operation of the PWM modulator, changing the slopes of the waveforms, and the gain of the system. This is especially true of current-mode control where the PWM ramp slopes are usually much smaller. In other cases, the real-world feedback waveforms introduce feedforward gains from the load current that have a significant effect on the output impedance. In all of these situations Eq. 2 becomes invalid.
Summary
This article clearly shows the relationship between loop gain and output impedance measurements. For a thorough power supply design and documentation, you should measure the output impedance and loop gain separately. Only direct loop gain measurements will give you dependable results for the high-noise environment and nonlinearities of a switching power supply. In some cases where the loop is truly not accessible, the only choice is to estimate. However, if the loop is accessible, measurements should always be made for reliable designs.
In the next article of this series, we will look at the audiosusceptibility measurement and its correlation to loop gain.
References
1. Ridley Engineering Frequency Response Analyzer from AP Instruments, www.ridleyengineering.com/index.php/analyzer.html
2. Ridley Engineering Design Center, www.ridleyengineering.com/index.php/design-center.html