Author:
Dr. Ray Ridley, President, Ridley Engineering
Date
10/23/2011
 PDF
PDF
In this article, Dr. Ridley, the results of measurements of control-to-output characteristics are presented for the multiple-output forward converter. It is shown how to reduce a multiple-output power supply to its equivalent single-output buck converter. Measurements and predictions are compared.
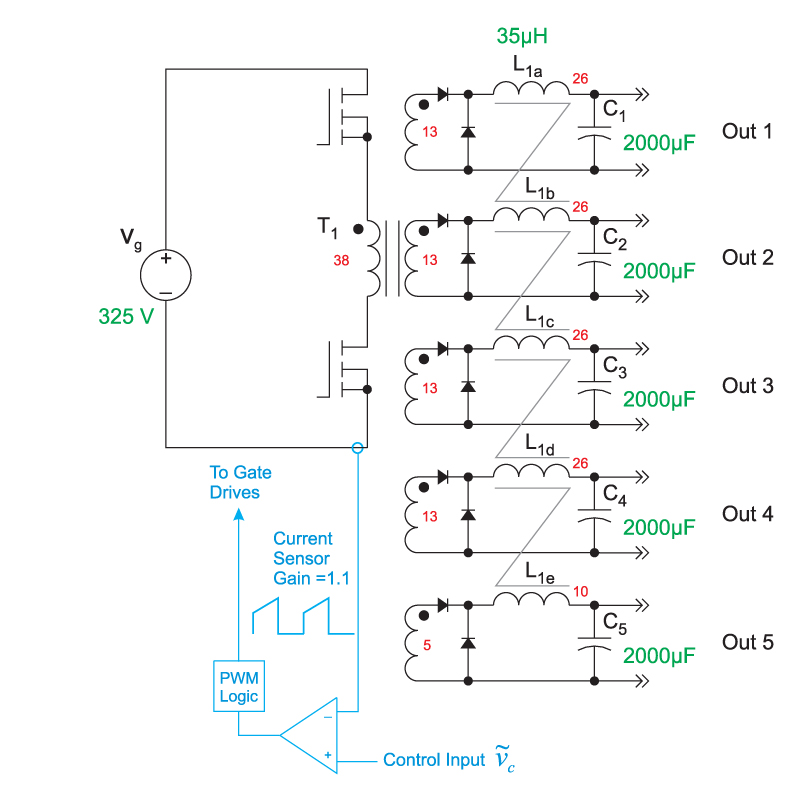
Figure 1 shows the five-output forward converter with coupled inductors. The turns ratios of the magnetics are shown, and these will be used to reduce the converter to a system which can be modeled more easily.
Click image to enlarge
Figure 1: Forward Converter with Five Coupled-Inductor Outputs. Current Feedback is Taken from the Primary Side of the Circuit.
The primary current is sensed as described earlier in this series of articles, and is scaled by 1.1 to provide the voltage signal for the feedback comparator.
There are very few articles which deal with the small-signal characteristics of multi-output converters. As will be seen later, there are complexities of multiple outputs which are difficult to model exactly.
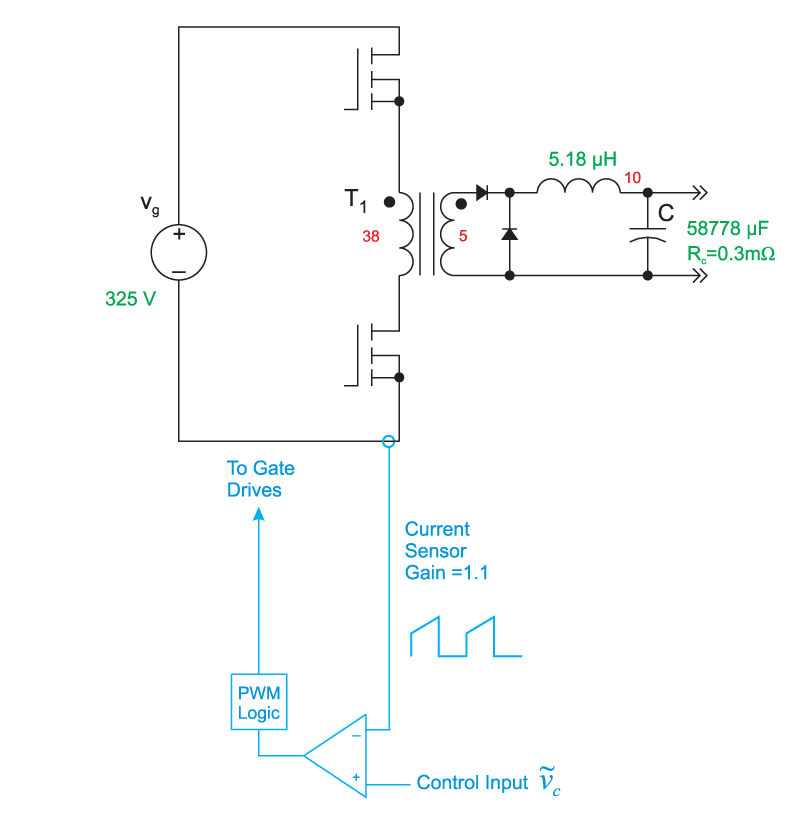
The first step in arriving at the transfer functions for the circuit is to reflect all of the output components to the output which will be regulated. For this circuit, the 12 V output goes to the feedback controller, so all output capacitor values and load resistor values are reflected through the inductor and transformer turns ratios to arrive at the equivalent model shown in Figure 2.
Notice that the inductor value of 35 ÂμH on the higher voltage output is reduced by the square of the transformer turns ratio 5/13. The capacitor value of 8000 ÂμF is increased by the square of the transformer ratio 13/5. This results in a rather large equivalent capacitance of about 59,000 ÂμF for the 12 V equivalent circuit.
Click image to enlarge
Figure 2: Five-Output Forward Converter Reduced to a Equivalent Single-Output Forward Converter
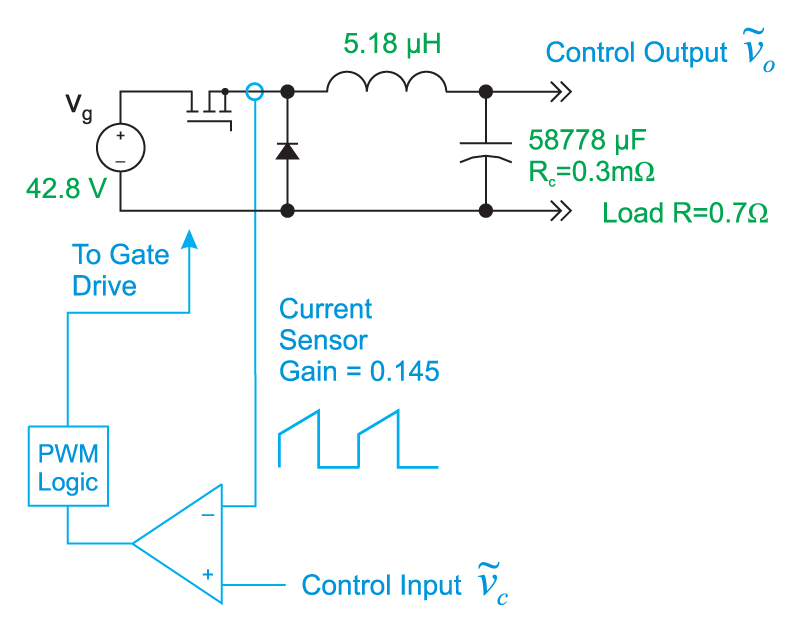
The second step in arriving at the model is to reduce the circuit further to an equivalent buck converter, shown in Figure 3. The input voltage is reduced by the transformer turns ratio, and primary resistances are reduced by the square of this ratio.
Click image to enlarge
Figure 3: Equivalent Buck Converter for Small-Signal Modeling
Once the buck converter equivalent circuit is found, the transfer functions for current-mode control are well known, as derived in [2].
The current-mode transfer functions for the basic converters can be found in Reference [1], with full details of the derivation given in [2]. The equations are given below for readers that are interested in the theory.
For the current-mode buck converter, the control-to-output transfer function is given by:
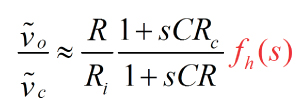
The first part of this expression is the transfer function obtained for a simple controlled current source feeding the output capacitor and load. The second part of the expression, shown in red, gives the correct modeling for the tendency of current-mode converters to oscillate at half the switching frequency. A pair of double poles is introduced in this expression given by:
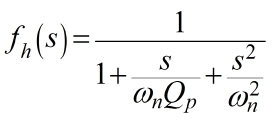
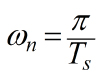
Where the radian frequency is determined by
And the damping is determined according to
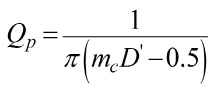
and
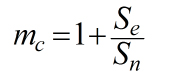
For this particular forward converter, it was not necessary to add a compensating ramp, Se, to the system. Adequate ramp compensation is provided by the sensed magnetizing current of the transformer, as is usually the case with forward converters where the current is sensed on the primary.
If you want to plot these transfer for yourself, you can use the free software provided in [3]. More advanced modeling with additional parasitic components and large-signal simulation is provided in [4].
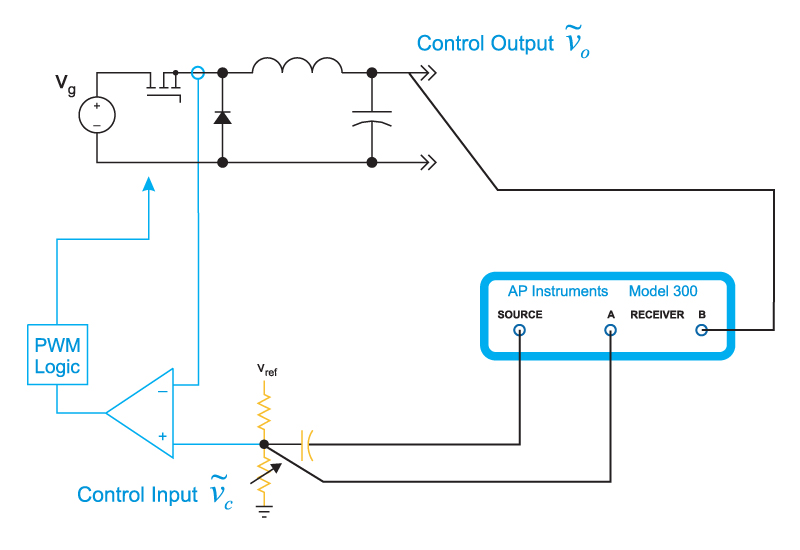
The control-to-output transfer function can be measured with the test setup shown in Figure 4. For new designers, it is important to point out that great care must be taken when working with high-voltage, and high-power circuits. It is always better to err on the side of caution when moving test probes and changing compensation components. Always turn the circuit off when moving connections. If possible, the control circuit should be grounded with a safety ground connection to keep high voltages away from test equipment as much as possible.
Click image to enlarge
Figure 4: Measured Setup for Control-to-Output Transfer Function
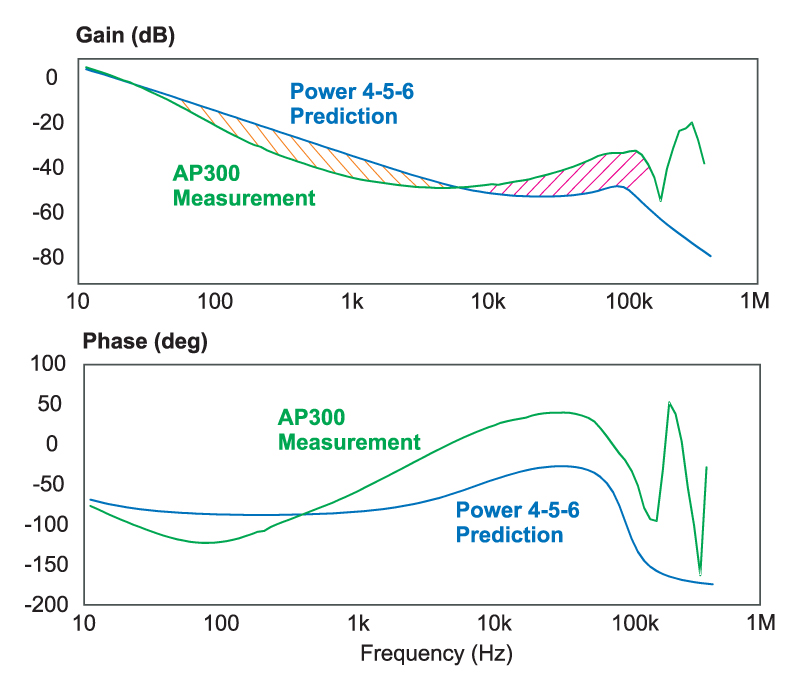
Figure 5 shows the result of the measured and predicted control-to-output transfer function for the multiple-output power supply. The measurements were made with a nominal input voltage of 240 VAC (325 VDC) and a load of 200 W.
Click image to enlarge
Figure 5: Measured and Predicted Control-to-Output Transfer Function
The lowest frequency parts of the measured and predicted responses are in very close agreement. However, there are significant discrepancies in the region from about 50 Hz to almost 10 kHz where the measurement is lower than predicted. Beyond this frequency, the measurements are higher than predicted.
There has been almost nothing published about this kind of result in the literature, despite the fact that this kind of result is typically seen in multiple output power supplies. The higher frequency deviations are a result of leakage inductances between the multiple outputs that cause the resulting effective capacitor on the single-output equivalent circuit to become lower than the fixed value given in Figure 3.
The lower frequency deviations are most likely a result of the ripple-steering effects which can be observed with multiple output coupled-inductor circuits. Very unusual effects can be seen with such circuit, including the generation of negative inductances in circuit models. Further discussion of this is beyond the scope of this article, and warrants attention from researchers who might be interested in an unexplored topic of power supplies.
It is very difficult, if not impossible, to generate accurate small-signal models that incorporate all of the effects and parasitic components necessary to exactly match measurements and predictions. This is one of the reasons why designing the control systems for power supplies still is very much an empirical process with a combination of both measurement and analysis to arrive at rugged designs.
Notice that both the predicted and measured responses predict quite low gains for the power stage due to the very large value of the equivalent output capacitor. This will present challenges in closing and measuring the loop of the circuit, as will be seen later in this series.
The multi-output forward converter was reduced to a single-output buck converter in order to perform the small-signal modeling of the power supply. The experimental results were compared with predictions, and significant discrepancies were found between the two. This is a common result for multiple-output converters. Much work still remains to be done in the field of modeling to properly explain these effects.
1. “Power Supply Design Volume 1: Control�, full color textbook by Dr. Ray Ridley
2. “A New Continuous-Time Model for Current-Mode Control� , PhD dissertation by Dr. Ray Ridley
3. Free Downloadable Power Supply Analysis Software