Author:
Blake Vermeer, Keysight Technologies
Date
01/27/2016
 PDF
PDF
From cellphones to electric vehicles and smart grid energy storage, the use of rechargeable batteries is dramatically increasing. Engineers that design products that use these rechargeable batteries must be able to characterize the battery performance in their designs. Programmable bidirectional DC power supplies and precision power analyzers enable engineers to gain insights into their designs quickly and easily. This case study show how a power analyzer and a source measure unit can be used to estimate battery life and measure the discharge curve and internal resistance of a battery.
Estimating Battery Life
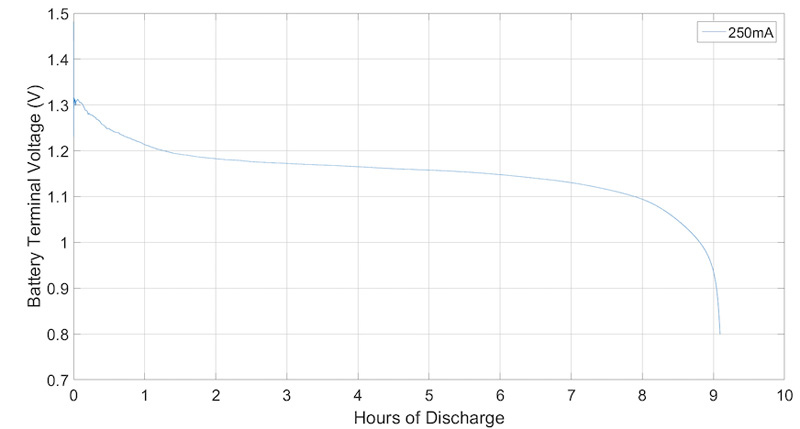
When designing a battery powered product the first thing that most people want to know is how long will the battery last in their product? This can be a fairly difficult question to answer as it depends on several factors. When first trying to answer this question most people will first turn to the datasheet of the battery. A lot of batteries include discharge curves for the battery at different constant loads similar to Figure 1.
Click image to enlarge
Figure 1: Battery Discharge Curve with 250mA Constant Load created by a Keysight N6784A source measure unit and measured by a Keysight PA2201A IntegraVision power analyzer
Given this information, if the average current draw and the cutoff voltage for the product was known, an estimate for the potential battery life of the product can be made. The issue with this type of estimation is that most devices do not have a constant current draw. This is especially true with wireless devices that constantly transmit and receive data. This type of product would be better modeled with a pulse load instead of a constant current load.
Modeling a Pulse Load
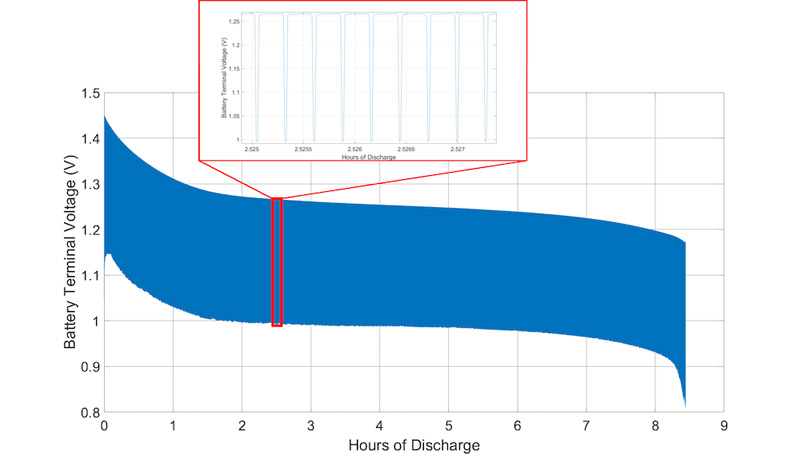
Using a programmable DC load and a power analyzer, it is easy to create a pulse load to estimate the battery life of a product with this type of current draw. Using a simple IVI program, a programmable DC load can be setup to create a continuous pulse load and to turn off the load when the battery reaches the cutoff voltage to prevent damage to the rechargeable battery. A power analyzer monitors the voltage at the battery terminals and continuously measures the current draw from the battery. This data is being continuously logged to a USB flash drive and then MATLAB is used after the test is done to take this data and create Figure 2.
Click image to enlarge
Figure 2: Battery Discharge Curve with Pulse Load created by a Keysight N6784A and measured by a Keysight PA2201A
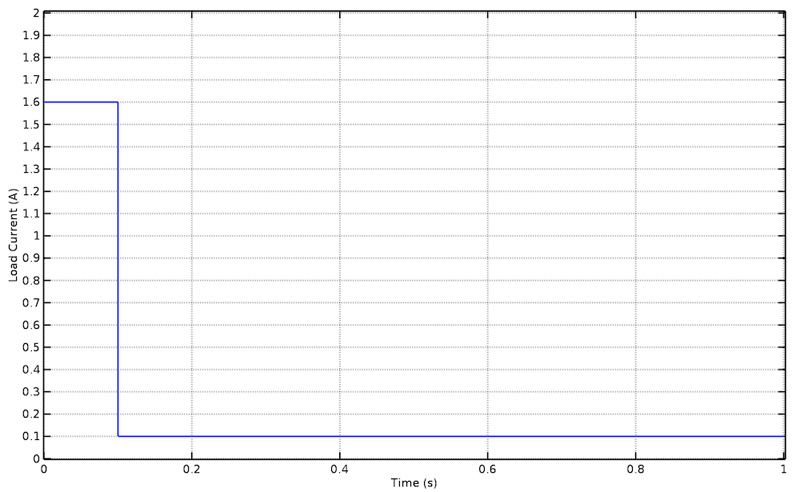
Figures 1 and 2 were both created using the same test setup and the same rechargeable battery. For the pulse load test, the load pulse used is described in Figure 3. This pulse load was created to have an average current draw of 250mA. By comparing Figures 1 and 2, we can see that the pulse load depleted the battery approximately 45 minutes sooner than the constant load did.
Click image to enlarge
Figure 3: Pulse Load created by a Keysight N6784A and used for figure 2
Also, the internal resistance of the battery causes battery terminal voltage to vary greatly during the discharge cycle. This variance in the battery terminal voltage is important for a hardware engineer to be aware of so that the input capacitance of the product can be properly sized.
Internal Resistance
Every battery has a certain amount of internal resistance. This internal resistance affects the maximum amount of current that a battery can source, creates a voltage drop, and also contributes to the heat being produced by a battery in use. A fairly simple way to model a battery is to think of it as a voltage source in series with a resistor (see Figure 4).
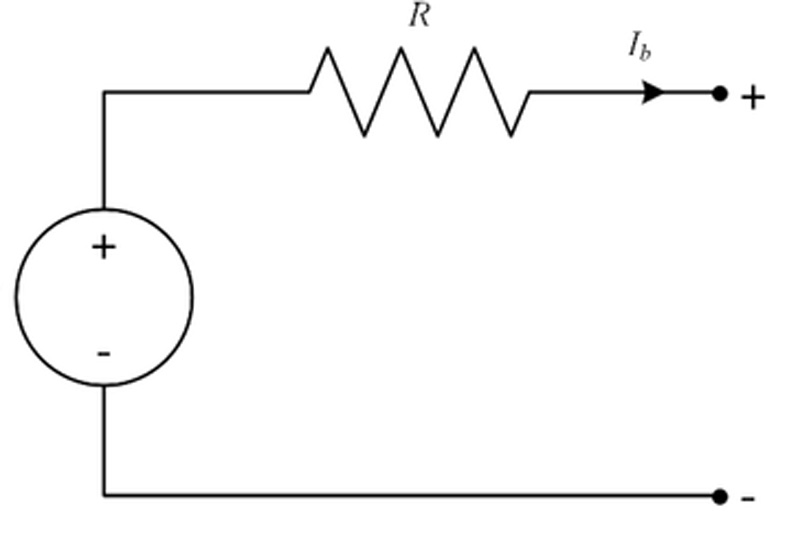
Clcik image to enlarge
Figure 4: Simple Battery Model
With this model in mind a test can be designed to measure the internal resistance of the battery. If a known current pulse is applied to the battery the resulting change in the battery terminal voltage can be measured and divided by the magnitude of the current pulse to find the value of the internal resistance. All of this information is available from the data collected by the power analyzer during the pulse discharge test used to create Figure 2; therefore, a plot of the internal resistance of the battery during the discharge cycle can be created.
From Figure 5 we can see that the internal resistance of the battery is approximately 180mΩ but varies during the discharge cycle.
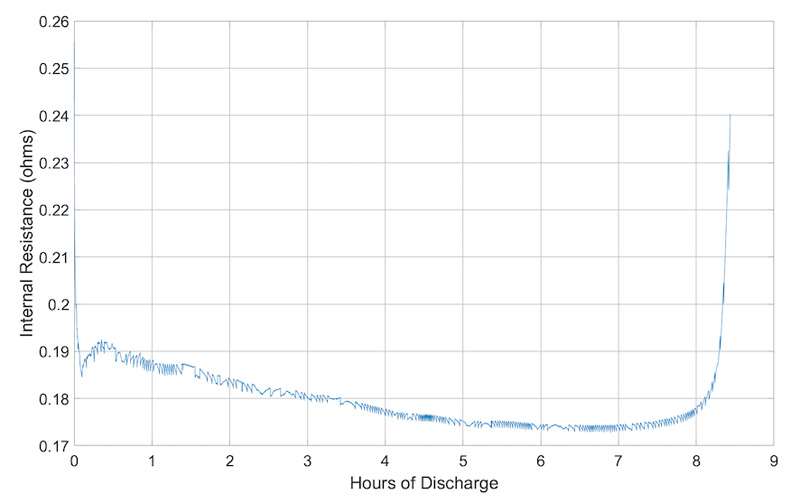
Click image to enlarge
Figure 5: Internal Resistance Measurement of a Battery created from data collected by a Keysight PA2201A
With the use of rechargeable batteries becoming more widespread in devices it is becoming increasingly important to fully understand the characteristics of these batteries. Power analyzers and programmable DC loads can help provide insight into these characteristics.