Reenvision Inductor Operation to Optimize New Applications
Proper presentation of off-the-shelf inductors with real-world data helps to take full advantage of applications.
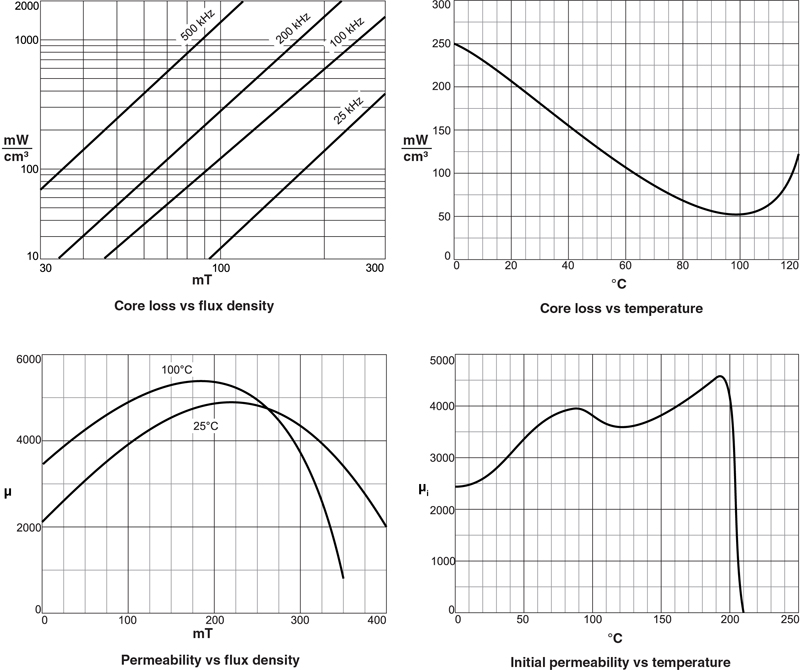
Figure 1: Core material performance curves
What do new applications need in order to take advantage of new devices like wide band-gap semiconductors? They need the best inductors. And what is the best inductor for your application? Answering that requires proper characterization of the inductors, which is more than can be conveniently obtained from traditional datasheets. The challenge, then, is how to identify the best inductor for your specific application without having to become a magnetics design expert. Luckily, some inductor manufacturers are stepping up with access to better inductor data than ever before, and better ideas for how to use those inductors.
Typical datasheet specifications for inductors include such standard ratings as dc resistance, inductance tolerance, and current ratings for inductance drop (Isat) and self-heating (Irms). These ratings have been on inductor datasheets for years, enabling comparisons between one or more supplier’s product lines. However, it is unreasonable to expect that such datasheets can provide suitable information for all new applications and operating modes. Rather, it is incumbent upon inductor suppliers to provide a means to understand how their inductors will perform under a variety of specific operating conditions.
That said, the key to better inductor performance also involves breaking away from old design rules, or “rules of thumb”……. especially the practice of automatically constraining ripple current to a specific percent of load current.
Become a Magnetics Designer
Inductance, resistance, and current ratings are common and available from many manufacturers. However, they all have the same limitation in that they are relatively static ratings and do not readily include the effect of frequency, the impact of ac signal size, or environmental factors like temperature. So how do you predict inductor behavior under a range of previously unanticipated operating conditions? The first way is to dive into details of inductor materials and construction. To fully model inductor performance, one must know the number of coil turns, the layering of those turns, the wire diameter, along with the details of the coilform needed to contain the winding. For the core, one must know the material characteristics (including the permeability, the B-H characteristic and loss parameters,) keeping in mind that all the core parameters are sensitive to temperature, frequency, and excitation. Figure 1 shows the typical published curves required to model just one ferrite core material.
For those who wish to (or must) design their own custom magnetics, it is necessary to invest time on these details. However, the good news is that some inductor manufacturers are stepping up to provide the necessary tools so designers can find the inductors they need, with high confidence in the predicted performance.
Tools for a Better Method
By enabling designers to identify off-the-shelf inductors for their specific applications by using complete inductor characterization data, Coilcraft’s new DC-DC tool eliminates the need to know every mechanical and material specification and become an “inside the inductor” expert. Predicting the performance of standard inductors based on measured data allows designers to make choices quickly and spend more time on other design priorities.
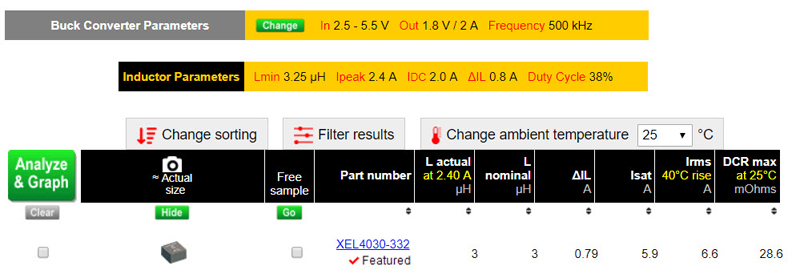
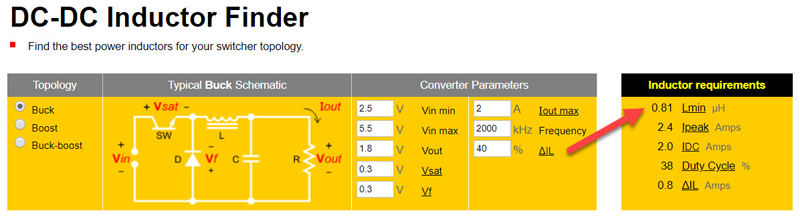
Consider the task of finding the best inductor for a simple 500 kHz buck converter with the following requirements:
Vin = 2.5 – 5.5 v
Vo = 1.8 v
Io = 2A
A common procedure is to calculate the required inductance by applying an arbitrary “rule of thumb” constraining the ripple current to be 30% or 40% of the average load current. Choosing 40% for this example, the needed inductance is calculated to be 3.25 mH from L = V/(di/dt), and the peak inductor current will be 2.4 Amps. The inductor requirements can be found on datasheets as Irms, Isat, and inductance (L).
Inductor Specifications:
Irms = 2 A
Isat = 2.4 A
L = 3.25 mH min
Instead of searching dozens of pages, Coilcraft’s DC-DC inductor finder quickly identifies the XEL4030-332 as the leading part with the following specifications.
XEL4030-332 Specifications:
Irms 6.6 A
Isat = 5.9 A
Lnom = 3.3 mH
Click image to enlarge
Figure 2: “Rule of Thumb” search results
For efficiency, the loss in the coil can be simply estimated as Ploss = I2*DCR = 114 mW, which for a full-load throughput power of 3.6 watts results in an inductor efficiency of about 97%. The inductor has high efficiency, and the average current is well under the Irms rating of the inductor: it should run nice and cool.
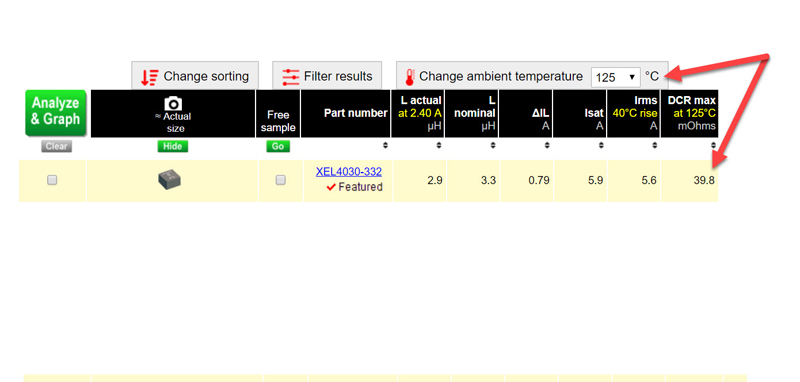
In a simple view, that could be the end of the process. An inductor was quickly found based on a very simple set of specifications. However, how do we know this is the optimum solution? What do we know about performance beyond nominal conditions? Take DCR, for example. The efficiency was calculated from DCR = 28.6 mW Max, directly from the Coilcraft datasheet. Like many datasheet parameters, that measurement was specified at room temperature, but it must be recalculated for expected temperature extremes, which is easily done within the Coilcraft tools. As shown in Figure 3, the max DCR becomes 39.8 mW when the ambient temperature is raised to 125° C
Click image to enlarge
Figure 3: Application-specific search results
At max temperature, the voltage drop across the inductor is about 40% above the room temperature value, and Ploss increased to 159 mW, up from 114 mW.
This example demonstrates that even a simple parameter like DC resistance can be sensitive to application conditions. Additionally, as wide bandgap devices enable new operating modes, and as inductors are being selected for new switching frequencies, fast switching transitions and duty cycles, design tools with fully characterized inductors are increasingly necessary to predict performance for these new application conditions, without the need to return to core material charts.
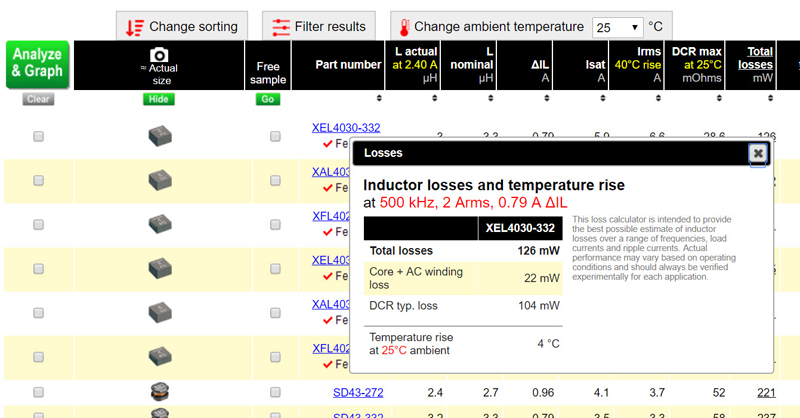
Inductors in the Coilcraft tools have been characterized with hard-switched waveforms over a wide range of frequencies and ac excitation (ripple current), enabling users to accurately predict ac losses. For the previous example, the Coilcraft tool shows ac losses about 20% of the calculated DCR loss.
Click image to enlarge
Figure 4: Predicted AC losses at 500 kHz
With the Coilcraft tool, you can quickly examine performance for different operating conditions. For example, as you would expect with a 4x increase in switching frequency, operating the same inductor with the same ripple current at 2 MHz shows higher ac losses. However, putting this into real numbers also demonstrates how minor the impact might actually be depending on your conditions of interest. It would be a mistake to focus only on the ac loss increase. In this case, the ac loss at 2 MHz is a significant percentage higher than that at 500 kHz. But consider, for example, the small impact on inductor temperature rise. At 2 MHz, the inductor only has a 7° C rise compared to 4° C rise at 500 kHz – hardly a measureable difference. Considering the inductor itself carries a max temperature rating of 165° C, and it probably sits next to a hot switching device, the extra inductor loss at high frequency would surely be considered trivial.

Click image to enlarge
Figure 5: Predicted AC losses at 2 MHz (4 X 500 kHz)
This shows that the proper tools with real data can help put something scary sounding like “double the core loss” into perspective. The next challenge is to use this data to help identify the desired combination of performance and size.
New Thinking
With a traditional approach – even with an advanced filtering/finding/analyzing tool – you would be faced with a one-step-at-a-time process. That is, enter new conditions and see what is available. In the previous example, simply change the frequency to 2 MHz and calculate the new inductance specifications.
Click image to enlarge
Figure 6: Calculated inductance at 2 MHz
However, this approach still uses the same old rule of thumb. Right from the beginning of the process, the 40% ripple current rule of thumb has limited the inductor choice to a specific narrow range.
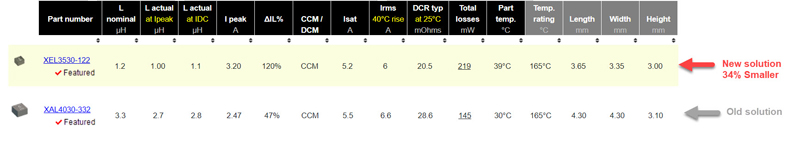
The Coilcraft DC-DC inductor tool has recently been fitted with a calculation to provide a new level of optimization by eliminating the need to start from an assumed rule-of-thumb. The idea is simple in concept, but powerful in results. Simply put, the tool calculates possible operating parameters, including the resultant ripple current, for the entire list of off-the-shelf inductors. As shown in Figure 7, by eliminating the artificial 40% ripple current constraint from the calculations, inductors with footprints up to 34% smaller are now included in the results.
Click image to enlarge
Figure 7: Additional solution option without 40% ripple current constraint
Instead of the 3.3 mH inductor selected for 40% ripple current, the calculator is able to identify a solution using 1.2 mH, with a corresponding different ripple current. The ripple current is now 120% of full load current, with a correspondingly higher peak current of 3.2 A instead of the previous 2.47 A. The losses in the inductor have increased from 145 mW to 219 mW, and while this is admittedly a large percentage increase, this is still a small number in real terms, which is reflected by the small increase in self-heating. The new inductor solution is predicted to rise to an inductor temperature of 39° C instead of 30° C. We would expect these efficiency differences to be insignificant for most applications considering the potential to save 34% of the pcb area with the first inductor.
Conclusion
No tool can definitively determine the “best” solution for all applications because priorities change. Some applications value size more than efficiency or vice-versa. Some applications put a priority on limiting the peak current whereas others are more concerned with average current draw. The limitless variety of applications requires tools that allow you to determine your own preferred solution. The best tools are based on real components and real data and allow users to envision creative solutions beyond the limits of “tried and true rules of thumb.”
Coilcraft, Inc.