Reliably Predicting Supercapacitor Service Life
This article presents the background of degradation mechanisms in EDLCs, provides an overview of phenomenological lifespan models, and discusses endurance test results
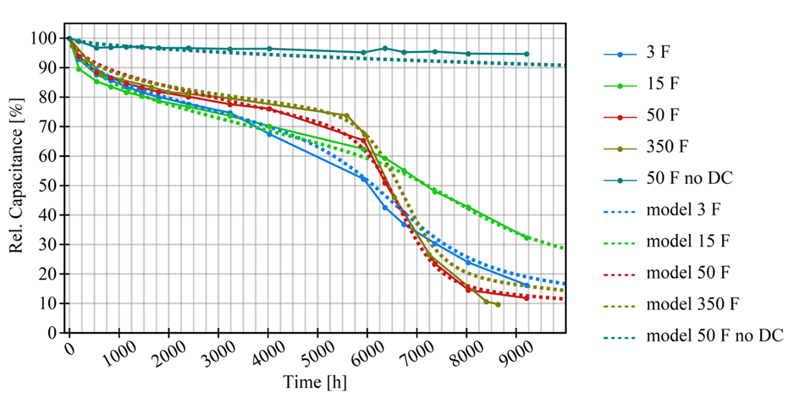
Figure 1: Relative capacitance over time for different batches, including the model curves. The model for the short-circuited 50 F batch (without DC) uses the same set of parameters as for the 50 F batch under voltage
Product reliability and sustainability are becoming increasingly essential for both consumers and manufacturers. Even though electrolytic capacitors such as electric double-layer capacitors (EDLCs) may not cause a significant environmental impact or total cost compared to other electronic components, degradation in a single part can lead to the failure of an entire unit. Therefore, estimates of component degradation and lifespan are essential for the design of reliable and sustainable electronic devices.
Charge storage in EDLCs is primarily a non-Faraday process, which results in a capacitive charge storage characteristic. Faraday processes also occur, but they are subordinate to capacitive charge storage as long as operation takes place below the breakdown voltage. In Faradaic processes, charges cross the interface by an electrochemical reaction, such as reduction or oxidation. In the non-Faradaic case, charges (i.e., ions) present in the electrolyte do not cross the interface but accumulate at the electrode interface in a double layer. These charges are balanced by mirror charges of opposite polarity at the electrode, supplied by the connected power source.
Faraday processes, however, cause electrochemical degradation of the electrode system, with the anodes being more severely affected than the cathodes in terms of specific surface area and pore volume. This process occurs even below the rated voltage of the EDLCs and the decomposition voltage of the electrolyte. The performance degradation of the supercapacitor is attributed to reduced ion mobility in collapsed pores and reduced specific surface area.
The two predominant factors that accelerate electrochemical decomposition and thus aging in EDLCs are temperature and voltage. Since there is no abrupt failure that marks the end of life (EOL) of EDLCs, the EOL of many commercial products is defined as a 30% loss in capacitance and a 100% increase in equivalent series resistance (ESR). Consequently, an EDLC experiences a gradual decrease in capacitance during operation, accompanied by a steady increase in ESR.
In terms of design-in, there are three approaches to counteract performance losses: selecting operating parameters as low as possible, oversizing the capacitance, or lowering the operating temperature. However, the operating temperature is usually dictated by the application environment.
Therefore, in many cases, the engineer has no choice but to oversize the capacitors or adjust the operating voltage by modifying the charge management system or connecting individual capacitor cells in series. To determine an appropriate degree of oversizing, an estimation of the time-dependent behavior of the capacitance for given operating parameters such as current, voltage, and temperature is required. Such models are often referred to as calendar aging or cycle aging models. Since the aging effect caused by charging cycles is minor in EDLCs aging models can be well described by the parameters of temperature and voltage.
Modeling Approaches
Modelling calendar aging in lithium-ion batteries and capacitive systems typically relies on phenomenological models. Mathematical functions are proposed and then fitted to experimental data from accelerated aging tests conducted at higher temperatures under specific voltage conditions. The influence of parameters such as temperature, voltage, and state of charge is then introduced through separate acceleration factors, often in the form of an exponential function. Studies suggest that voltage-accelerated aging can be represented by a factor that is independent of temperature. This justifies describing voltage and temperature accelerated aging using individual factors.
Exponential Time Dependence of Degradation
Würth Elektronik has developed a model that assumes a proportional decrease in capacitance and conductance per time step.Extensive long-term measurements were conducted to develop and refine the model. The test series included batches of 32 commercially available EDLCs from Würth Elektronik each, with capacitances of 3 F, 15 F, 50 F, and 350 F. The test duration was approximately 9,000 h (≈ 1 year) at 65°C and approximately 35,000 h (≈ 4 years) at room temperature (approx. 24°C). The circuit boards were connected via board-to-board connectors to a DC power source that continuously applied the nominal voltage of 2.7 V. To investigate the effects of high-temperature storage, 32 units of the 50 F capacitor were also stored under short-circuit conditions. To minimize temperature fluctuations during the tests at 65°C, both the charging and the measuring connections were in the climate chamber.
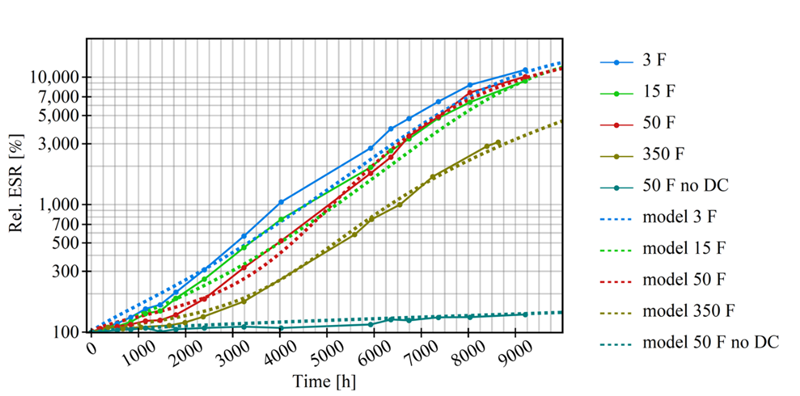
The average relative capacitance and ESR measured over a period of approximately 9,000 hours at 65°C are shown in Figure 1 and Figure 2, respectively. The results show significant degradation in EDLCs under voltage and a notably more moderate decline in the short-circuited sample. The degradation model described above was adapted to these long-term measurements; it describes the measured values precisely with a mean absolute percentage error (MAPE) between 2 % and 15 %.
Typically, capacitance decreases during the first phase (approximately 1,000 to 3,000 hours) according to the power-law. This degradation is associated with the electrothermal decomposition of the electrolyte and/or the loss of active electrode surface area. The second phase, which begins at approximately 4,000 to 5,000 hours, has been less intensively studied to date. It is suspected that this wear out phase is accompanied by a further loss of active electrode surface area as well as the contact area between the electrolyte and the carbon electrode. The ESR shown in Figure 2 increases by several orders of magnitude. For the 3 F and 50 F capacitors the rate of ESR increase appears to accelerate after approximately 1,000 hours and slow slightly after 8,000 hours. Below 6,000 h, the relative change in ESR and capacitance is smaller for larger capacitors than for smaller ones, meaning that larger types degrade more slowly.
The short-circuited 50 F capacitors age significantly slower than the cells subjected to the rated voltage (2.7 V). This demonstrates that degradation is significantly reduced but not completely prevented in the absence of an applied voltage. This suggests that the loss of electrolyte volume contributes to degradation.
Smaller capacitors could suffer a higher percentage of electrolyte loss relative to their case size. The type of seal likely plays a role as well: The 350 F capacitors feature a snap-in design where the base plate and the can are sealed by a flange (rolled edge). This could ensure a better seal than the rubber closure of standard cylindrical designs. At this point, however, this remains a hypothesis; electrolyte loss due to evaporation would need to be quantified in further gravimetric experiments. In terms of practical usability, the test results show that the capacitors remain functional even after exceeding the continuous load limit of 1,000 hours specified in the datasheet. Applications with lower current requirements could tolerate an increase in ESR beyond the defined end-of-life (EOL).
Click image to enlarge
Figure 2: Relative ESR over time for different batches with corresponding model curves
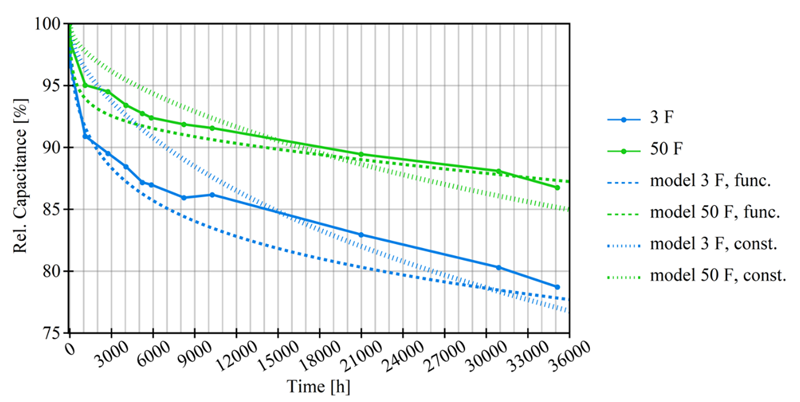
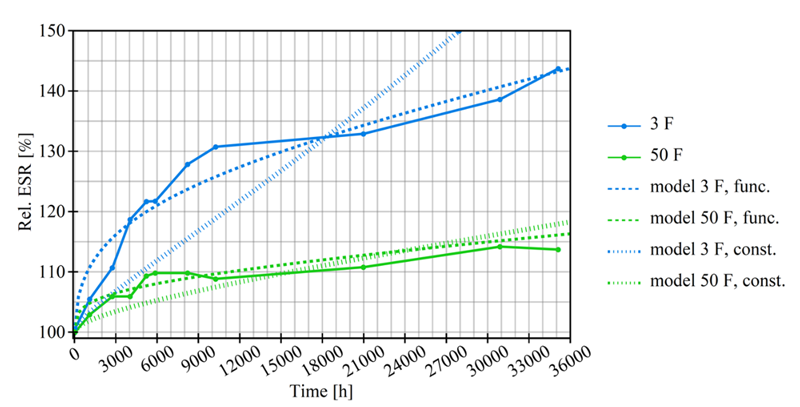
To validate the extrapolation of degradation to lower temperatures, the 3 F and 50 F capacitors were tested at room temperature (approx. 24°C). The median of the measured values recorded over four years (Figures 3 and 4) illustrates that the parameters remain within the EOL criteria (30% capacity loss, 100% ESR increase).
Click image to enlarge
Figure 3: Capacity of EDLCs during long-term measurement at room temperature and rated voltage
As with capacitance, the model leads to a slight underestimation of values below 15,000 h to 18,000 h and a slight overestimation of values above this range.
Click image to enlarge
Figure 4: ESR of EDLCs during long-term measurement at room temperature and rated voltage
The time-dependent factor generally better represents the trend of the measured values than the time-independent factor. However, the latter can provide a good approximation of the measurement for a specific point in time or degree of degradation and thus remains useful as a simple estimate. Although the measurements do not provide direct insight into the physical cause of the varying activation energies, they suggest that their distribution is influenced by progressive degradation. Apparently, the degradation cannot be attributed to a single process. Electrochemical reactions at the interface, the loss of liquid electrolyte due to phase transition, and the aging of the electrode system and housing components all interact. It is therefore plausible that the measured deterioration is due to multiple mechanisms leading to different aging phases and a distribution of apparent activation energies.
Multiple Degradation Mechanisms
Long-term measurements of capacitors at a temperature of 65°C as well as at room temperature and a permanently applied DC voltage of 2.7 V demonstrate two phases of degradation. The rate of capacitance loss in the second phase, beginning at approximately 5,000 h, is higher than in the first phase. The proposed phenomenological model, in combination with a time-dependent temperature acceleration factor, can accurately describe the degradation curves at two different temperatures and voltages.
A comparison between the accelerated tests at 65°C and the long-term measurements at room temperature, which spanned approximately four years, showed that the temperature factor changes over time. While a time-independent factor can serve as an initial estimate, the model accuracy can be significantly improved by using a time-dependent temperature factor. The observed change in activation energy suggests that aging is driven by the interaction of multiple mechanisms.
The current acceleration factors serve as a helpful tool for life expectancy estimation in the design process to ensure a target service life through moderate oversizing or to predict EOL more accurately.