It is important in many cases to build system-level models and verify predictions with hardware measurements
Board-mount power supplies use multilayer ceramics for both their input and output capacitors. The inherently low ESR values lead to transfer functions with higher Q than converters using electrolytic capacitors, and this can lead to interesting effects when making measurements.
Many newcomers to the field of power supply design are very well trained in running simulations of their power supplies, and it is often a surprise to them to see how much the real world deviates from even the best thought-out models. More seasoned designers are less surprised by this, as they have long been aware that predictions of transfer functions must always be supported by good lab data.
Figure 1 shows the schematic of a boost converter designed for a 13 V, 2 A load. The input source for testing the converter was a 20 A adjustable bench power supply connected via about 50 cm of cable to the input of the boost converter.

Click image to enlarge
Figure 1: Boost Power Converter with Lab Supply.
A large amount of capacitance for a boost converter, 88 uF, was used to provide a stiff voltage source at the input to the boost. Normally board-mount designers will use much less than this since the ripple current into a boost converter is quite low.
Boost Converter Control Transfer Functions
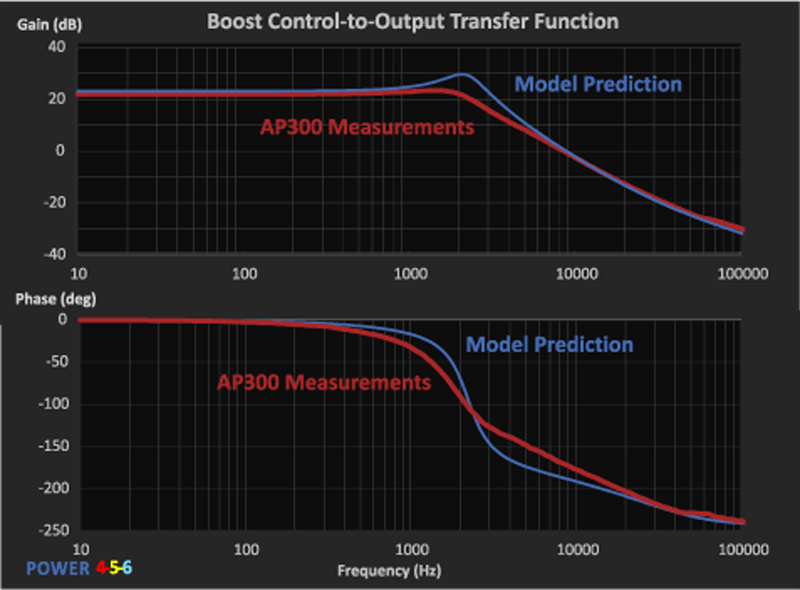
Figure 2 shows the measured transfer function of the boost converter from the control input of Figure 1 to the power supply output. An AP300 frequency response analyzer was used to make the measurements [1], and the design program POWER 4-5-6 was used to provide predictions of the transfer functions [2].
Click image to enlarge
Figure 2: Measured and Predicted Control-to-Output Transfer Function for the Boost Converter
The measurements shown in red have a significant deviation from the predicted results. At first glance, it looks like something in the power stage components is making the Q of the measured boost filter resonance significantly lower than expected. The resonant frequency itself is also lower than expected. Moreover, the curve looks distorted. This is often indicative of too much drive at the resonance, but adjusting the drive level did not make any difference to the measurement.
Figure 3 shows another measurement of the power stage transfer function, this time with a large electrolytic bulk capacitor added at the input of the boost converter. The new curve, shown in green, is much closer to the blue prediction. The filter is still more damped in the measurement, but this is to be expected since the prediction does not include switching loss and other known loss mechanisms in the small-signal model.

Click image to enlarge
Figure 3: Measured and Predicted Control-to-Output Transfer Function for the Boost Converter with Large Bulk Capacitor Added.
Boost Converter Interaction with Source
Many years ago, Dr. Middlebrook showed how a converter would react with its input filter, or source, if the output impedance of the filter becomes higher than the open-loop input impedance of the converter itself. This is exactly what is occurring in the system of Figure 1. To assess the interaction properly, impedances should be measured at the point shown to the left of the inductor in Figure 1. Measurement of these impedances using the AP300 analyzer is described in [1].
The measurement of the output impedance of the input source is shown in the red curve of Figure 4. The boost converter input impedance, also measured with the AP300, is shown in green. Clearly the two impedances violate the Middlebrook criteria, and significant modifications to the control transfer function can be expected. The area of overlap of the impedances between 3 and 4 kHz is circled in yellow in the figure.
It is coincidental that the peak in impedance of the input source, cable, and input capacitor occurs right around the dip in impedance of the boost filter itself. This is not an uncommon event, though, and it is very important to remember that this interaction can easily happen with high-Q power stages. The low ESR of the MLC capacitors creates a sharp dip in the input impedance of the power stage, and avoiding overlap of the impedances can be almost impossible.
The blue curve of Figure 4 shows the impedance of the source modified by the presence of a very large 10,000µF capacitor. The green curve is now well above the output impedance of the source, clearly showing why the measured transfer function in Figure 3 is very close to the prediction.

Click image to enlarge
Figure 4: Power Source and Connection Output Impedance Plotted Versus Boost Input Impedance
Notice that there is about 12 dB of separation between the blue and the green curves of Figure 4. This means that interaction could have been avoided by adding a capacitor about 4x smaller (12 dB), or 2500µF. This is an amazingly large value of capacitance needed for a low ripple converter like a boost. Most designers do not have the luxury of adding this kind of value, and they have to just accept a more complex system model.
The interaction of impedances does not mean that the system will be unstable -- that only happens if the output impedance of the source exceeds the closed-loop input impedance of the boost converter. The point of this article is not to suggest that the system may go unstable for board-mount converters, but to show that interactions between converters and filters in the system are quite likely to occur. Simple two-state models of the individual converters will not suffice to explain the observed measurements, and these effects should be included when trying to optimize feedback design.
Observing Interactions from Other Transfer Functions.
Sometimes it is simply impossible to break circuit paths to get at the needed impedance measurements. If you suspect this kind of interaction, however, there are other ways to observe problems. Figure 5 shows how to set up the AP300 to measure the control-to-input voltage transfer function. If there is an overlap of impedances, a significant peak of this transfer function will be observed as shown in the green curve. In some systems, such as current-mode control for a buck, this is the only place that the interaction can be observed, by that is a deeper topic which is too involved to present here.

Click image to enlarge
Figure 5: Control-to-Input Voltage Transfer Function Showing Significant Peaking at 3 kHz.
The power of interaction
In this article, is has been shown that board-mount power supplies can have a strong possibility of interacting with their power sources and other components around them. While this may not necessarily lead to instability in the system, you should at least be on the alert for observing significant modifications to the expected transfer functions. Regardless of how simple your power supply seems to be, or how much a chip vendor insists it is not necessary for their part, you should always make measurements of the loop of your power system to guarantee stability.
References
[1] AP300 Application Notes and Videos, www.ridleyengineering.com/analyzer.html
[2] POWER 4-5-6 Design Software, www.ridleyengineering.com/software.html
[3] Join our LinkedIn group titled “Power Supply Design Center”. Noncommercial site with over 4800 helpful members with lots of theoretical and practical experience.
[4] See our videos on loop testing and power supply design at www.youtube.com/channel/UC4fShOOg9sg_SIaLAeVq19Q
[5] For power supply hands-on training, please sign up for our workshops at www.ridleyengineering.com/workshops.html