A new sensor type combines the strong points of traditional RF power meters and measurement receivers.
It may sound obvious, but for precise power measurements with RF signals the instrument of choice is an RF power meter. Two power detection technologies have become established: thermal measurements and diode measurements. Thermal power sensors determine power based on the heat generated by an input signal in a terminating resistor. Diode based sensors measure power by rectifying the incident RF signal in the square-law region of the diode characteristic. Diode power sensors come in various versions, with multipath and wideband sensors covering the most important applications.
Compared with measurement receivers and spectrum analyzers, which are basically also suitable for RF power measurements, dedicated power meters offer higher accuracy, lower purchasing cost and more compact size. By contrast, receiver based instruments offer higher sensitivity and dynamic range.
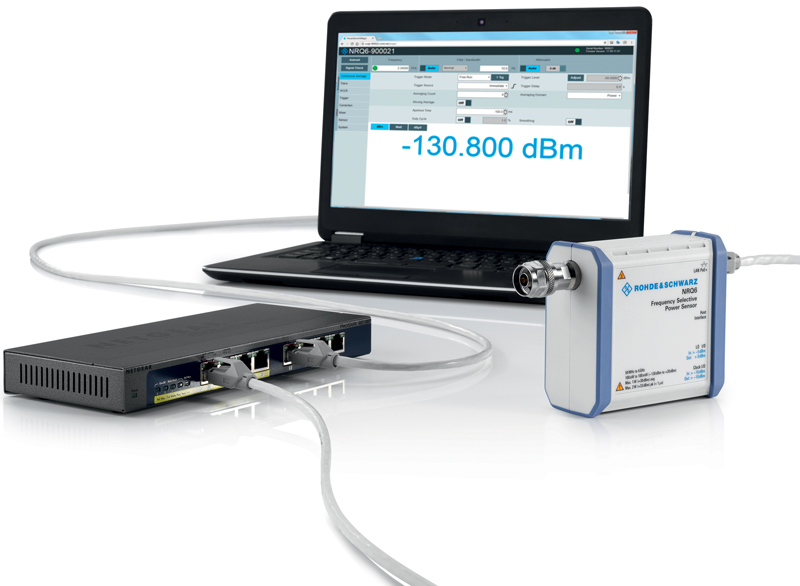
The R&S NRQ6 frequency selective power meter (Fig. 1) was developed to combine the advantages of both types of instruments. It relies on the measurement principle of a receiver, but its hardware concept differs significantly from that of conventional measurement receivers and spectrum analyzers. The key to its performance is its innovative system concept and smart digital signal processing.
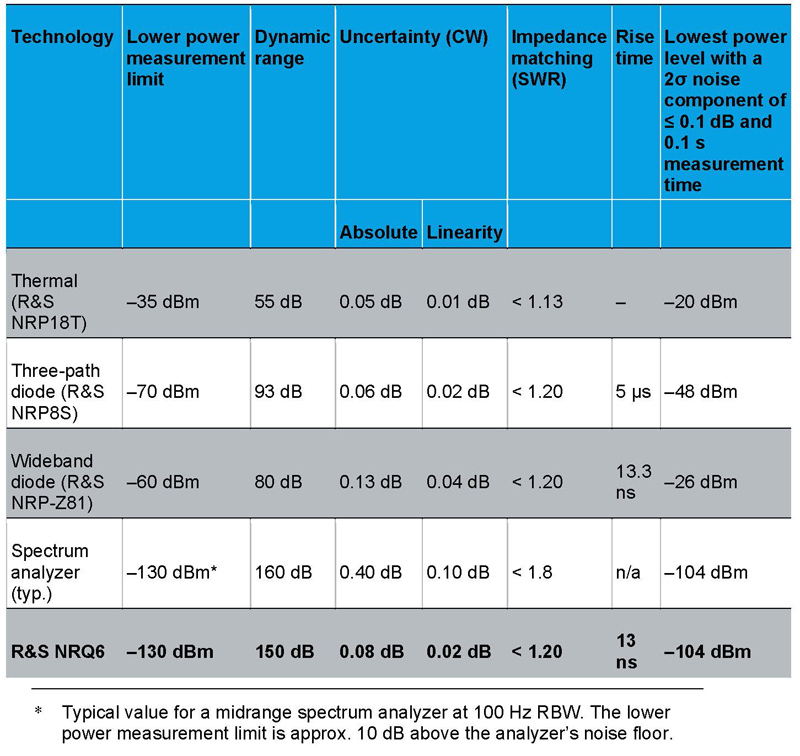
A comparison of typical key data (Fig. 2) demonstrates this leap in RF power meter design. A mid-range spectrum analyzer was chosen to represent a typical measurement receiver. The data shows that the R&S NRQ6 achieves better performance as it combines the advantages of different measurement concepts. It allows even very low RF powers to be measured fast and accurately. Moreover, it offers excellent linearity previously found only in top-class conventional power meters. The sensor can be configured for diverse applications.
Click image to enlarge
Figure 2: A comparison of the key data of different power meter technologies shows the superiority of the new concept.
Depending on the settings, it offers the following:
· A very wide dynamic range that sets a new record among dedicated power meters – outperforming them by several orders of magnitude
· A fast rise time and high video bandwidth previously only achievable with spectrum analyzers and very wideband power sensors
Simple operation as usual
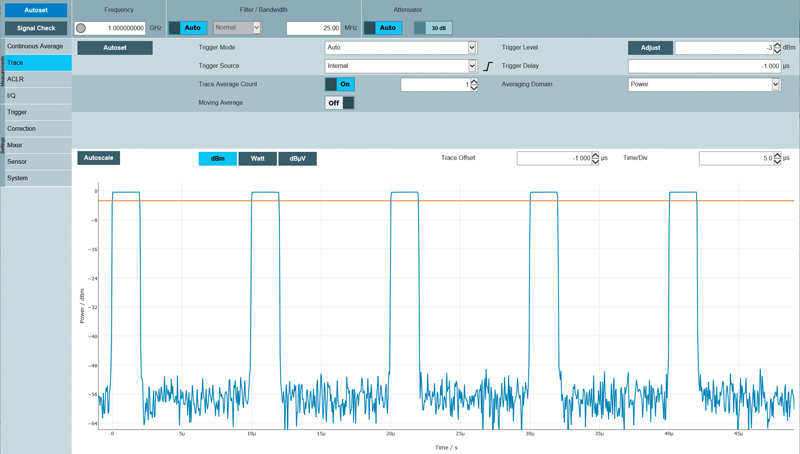
Getting started with the R&S NRQ6 is very easy. Simply connect the sensor to a LAN via a power over Ethernet (PoE+) switch. The HTML GUI can be accessed from any PC or tablet with a web browser to perform continuous average, trace and ACLR measurements (Fig. 3).
Click image to enlarge
Figure 3: Browser based GUI displaying a trace measurement.
Setting the measurement frequency and signal bandwidth is just as easy. This can be done manually or using the autoset function. Depending on the input level, a 30 dB RF input attenuator is automatically switched on or off to configure the optimal power measurement range.
Measurement functions
Continuous average power measurements down to –130 dBm
Conventional diode power sensors cannot perform fast and accurate measurements below –70 dBm due to the relatively high inherent noise component measured. The R&S NRQ6 is based on a receiver architecture which eliminates this problem. Plus, the sensor’s ability to perform band-limited measurements reduces the noise power. As a result, the power of narrowband signals can be measured down to –130 dBm, fast and with high precision. As a frequency selective instrument, the R&S NRQ6 is ideal for measuring intermodulation products, such as harmonics, and for performing measurements on selected transmission channels up to 100 MHz bandwidth. Neighboring channels are not taken into account. This feature is beneficial during measurements on multistandard base stations when users want to measure only one standard (Fig. 4).

Click image to enlarge
Figure 4: Selective measurement on a multistandard base station channel – a routine task for the R&S NRQ6.
Trace measurements
Power measurements on pulsed signals can be carried out in trace mode, which displays signals in the time domain (Fig. 3). With an inherent rise/fall time of 13 ns at a resolution bandwidth of 50 MHz, for example, the R&S NRQ6 can easily measure steep-edged pulses. The trace mode also offers autoset functions, e.g. to optimally scale the time and power axes. The trigger level is set automatically, ensuring stable display of the measured signal.
ACLR measurements
Adjacent channel leakage ratio (ACLR) is a standard measurement in mobile communications. ACLR measurements can be configured from the web GUI using predefined filters for 3GPP and LTE signals. The filters are set automatically. The R&S NRQ6 achieves an ACLR performance of typically –63 dBc for a 20 MHz LTE signal at –20 dBm.
When speed is essential: triggered measurements
Triggered measurements call for ever higher measurement speeds over an extended period of time. The R&S NRQ6 contains a powerful FPGA and a large memory to meet these requirements. More than 100 000 triggered readings can be stored in a buffer in 200 ms – corresponding to a measurement speed of 500 000 readings/s – and transferred to a control PC.
Helpful assistants
Automatic frequency tracking
Drift of the center frequency may occur when measuring power on narrowband signals. If it is not possible to connect the signal source to the R&S NRQ6 reference frequency input, the frequency tracker will automatically align the measurement window so that the drifting signal is always within the selected bandwidth.
Spectrum display for signal check
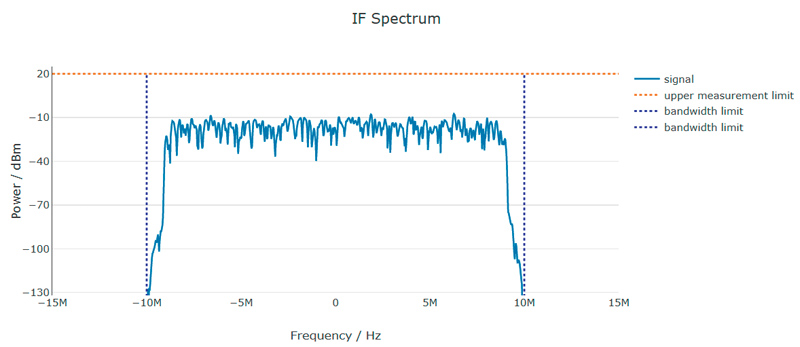
Since power measurements are performed only in the set frequency range (defined by center frequency and bandwidth), the settings must be checked to make sure they are correct. This can be verified at a glance using the signal check function. It graphically displays the test signal, measurement bandwidth and power measurement limit to help avoid any mistakes (Fig. 5).
Click image to enlarge
Figure 5: The signal check function reveals at a glance if the measured signal is within the set frequency range.
Applications
The R&S NRQ6 can be used for all power measurements up to 6 GHz previously accomplished with conventional sensor types. However, its advantages are particularly striking in some applications.
TX power calibration
To calibrate a DUT’s transmit power, it is necessary to compensate the frequency response at higher levels and measure linearity down to minimum levels. While these tasks previously required several different instruments, the R&S NRQ6 performs both measurements in a compact, single box. No additional instruments or components such as a splitter and spectrum analyzer are needed. The sensor can be directly connected to the transmitter under test; no cable is required. This solution provides better stability, lower mismatch and higher accuracy.
Click image to enlarge
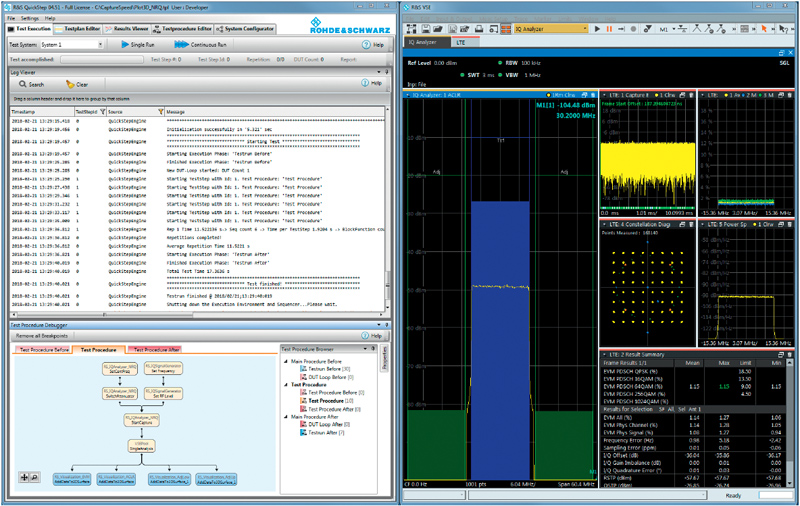
Figure 6: The R&S NRQ6 can be used as a standalone RF frontend for capturing I/Q data. The data is analyzed using external software. Automated data analysis is also possible, for example with the R&S Quickstep test executive software.
I/Q data capturing for RF vector signal analysis
The R&S NRQ6 can be used as a standalone RF front-end to capture vector-modulated I/Q signals. With the optional R&S NRQ6-K1 I/Q data interface, captured I/Q data can be read out using SCPI commands. The data is demodulated and analyzed using external software. Automated, cloud based signal analysis is also possible using the R&S Quickstep test executive software. R&S Quickstep can control any analysis tool to measure error vector magnitude (EVM) and ACLR (Fig. 6).
Rohde & Schwarz