An Easy and Cost Effective Method of Generating Bode Plots

Frederik Dostal from Analog Devices talks to PSD about how the company's recently launched LTpowerAnalyzer can simplify bode plot generation.
One of the most difficult aspects of power design is judging how the circuit will react to different loads, especially in terms of the power supply control loop stability and bandwidth. How quickly will the voltage change from one level to another as a load is connected and disconnected? Will it overshoot, by how much, and how long will any ringing last?
It is possibly to use transient testing to estimate figures on the stability and bandwidth of a power supply, but that process is limited in the amount of details that it can give, and it is difficult to compare results. If you do try replicate the test, small differences in output voltages or layout can have large differences in results. The amplitudes of the output voltage overshoots could be theoretically compared, but that won’t detail how quickly the circuit reacts. Most importantly, load transient testing doesn’t help with ‘what ifs’, and there is no real way to determine what figures are good and bad and which ones can easily be improved.
To improve load testing processes, some engineers build large dynamic loads using MOSFETs and resistors. The MOSFET are then used as switches to control the speed of the load transient in the time domain. These load slammers can be costly, and they are often hand built, meaning that it it can be difficult to build a single load jammer device to operate with a variety of output voltages and loads.
An alternative way to perform power supply stability and bandwidth tests is by generating a bode plot, which provides accurate results for the stability of the loop, the phase margin of the loop, and the zero dB crossover figure, which directly gives an indication on the speed of the loop. These figures can easily be compared from one power supply to the next, allowing quick and easy decisions to be made. The only problem is that generating bode plots usually needs a range of hardware and software that can become quite expensive, as well as being time consuming to set up for different tests.
To assist engineers generate bode plots, as well as to perform load transients tests in a cost effective way, Analog Devices has recently made available its LTpowerAnalyzer. The tool has been used internally by the company’s field engineers for some time, but is now on general sale. It is small, fast, and comes in a package with all of the hardware and software necessary to generate bode plots and take other useful measurements, such as transient plots and output impedance measurements.
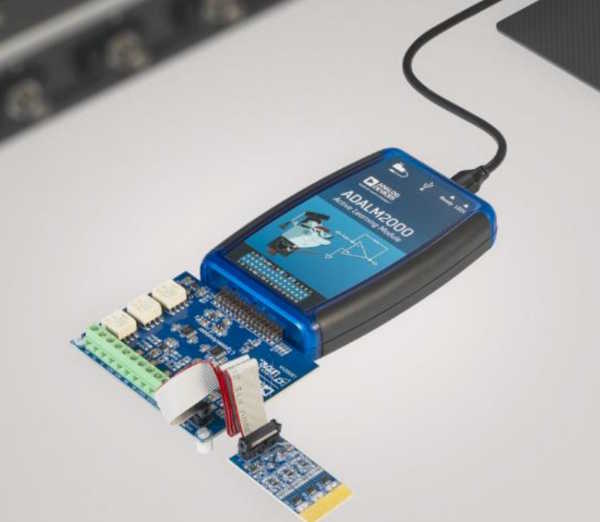
Figure 1 - testing a power supply using the LTpowerAnalyzer
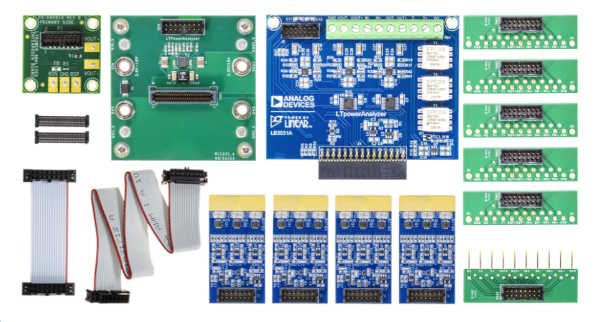
Figure 2 - All of the necessary boards and connections are included in the pack
Frederik Dostal, Subject Matter Expert for Power Management at Analog Devices explains, “The LTpowerAnalyzer was an internal tool that our field application engineers used to help customers. It's pocket sized, and makes it very easy to generate bode plots. The package includes the LTpowerAnalyzer itself, the ADALM2000 pocket oscilloscope, adapter boards that attach the LTpowerAnalyzer to any kind of test board, four different load boards, and a sample power supply, as well as all of the software required. It operates by injecting a small sine wave at a single frequency into the feedback path of the output voltage in order to get a bode plot of the loop. The AC measurement block takes the amplitude of the sine wave as it is injected. Then the amplitude and the phase shift of the sine wave are measured as it exits the loop. We can then easily see how the system influences that input signal, how the amplitude changes, how the phase changes, and that gives us one point in our bode plot.”
The included sample power supply provides a test circuit to familiarize the user with the setup before testing their own devices. The ADALM2000 pocket oscilloscope kit has been around for many years, and was mainly sold to universities and engineers as a low cost pocket oscilloscope and signal generator. It provides a two channel USB digital oscilloscope and a function generator. The ADALM2000 interfaces via a USB cable to the PC, which runs the software. The system acts as a network analyzer, and sweeps frequencies from 1Hz to 10MHz – a large enough range for generating any bode plot for loop stability. The LT Power Analyzer connects to the Device under test (DUT) using a ribbon cable and also to the ADALM2000. The DUT is also attached by a ribbon cable to the load board. Four load boards come in the package in 1A, 10A, 50A, and 100A variations. The box also comes with five different adapter boards that can be connected to the DUT. These boards negate the need for constant soldering and desoldering, allowing easy testing of different boards at the same time or performing different evaluation processes.
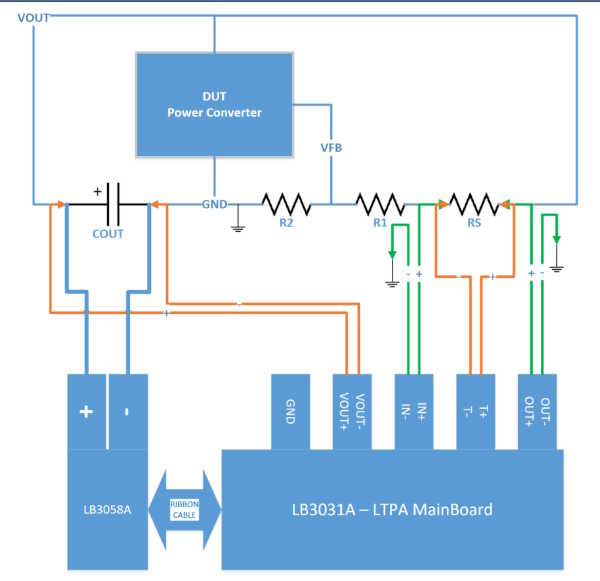
Figure 3 - The test circuit
The software runs on a Windows PC and controls the testing of the system. It allows the setting of the start and the end frequencies of the bode plot, as well as its measurement points. Different signal amplitudes can also be programmed to adapt to a variety of power supplies. Other settings are also configurable, such as the load current, the high current, the pulse width, the pulse duration, and the duty cycle. Continuously measurements are then performed over the frequency range and a variety of results and analysis are displayed in real time to compare metrics such as amplitude overshoot.
Dostal expands, “You can set load transients in the software, for example if you want to go from 100mA to 1A. You can even go up to 100A of load transient on the board, as these are very short tests, so things will not heat up too much. The whole system and the software has to be programmed so that the load boards are always protected. However, additional protection is included, so that if there is a wrong setting in the software that has a duration that the hardware cannot handle, the software will automatically limit the test to stop it overheating. So it's a really safe testing environment to do load transient tests.”
He concludes by saying, “the system’s main role is to generate bode plots of the regulation loop of a power supply and also transient plots when there is a load transient on the output. However, it is also capable of taking output impedance measurements for engineers that would like to see how the impedance looks on the output of the power supply. This figure can be important for when an additional filter is added to the power supply to ensure that the filter and the power supply combined remains stable. It can be measured with this hardware very easily and very quickly.”
.jpg)