Optimizing the intermediate bus using digitally controlled advanced bus converters
Figure 2: Measured data for the Ericsson BMR450 20-Amp power module when varying input voltage from 4.5 to 14 volts and with load from zero to 20 Amps.
This case study presents the results of Ericsson's findings of using a novel algorithm to optimize intermediate bus voltage. This approach saves significant energy and cost, while increasing reliability. The intermediate bus architecture (IBA) was introduced to the datacom industry in the late 1990s. Since then, the intermediate bus converter (IBC) has moved from being a passive power source, converting a system voltage to sub-system, to an active, intelligent power source: the advanced bus converter (ABC). The simulation environment in this case study is based on models extracted from a combination of a point of load voltage regulators (Ericsson 3E Series BMR 450 and BMR 451) powered by an advance bus converter (Ericsson 3E series BMR 453). The outcome of the simulation demonstrates how suitable the algorithm is for future implementation in the embedded firmware of a digital power controller or within a board power manager. The conventional IBA In late nineties, facing an increase in demand for sub 5V, high current microprocessors and associated components, combined with high system integration, the datacom industry introduced a new power architecture based on a main on-board DC/DC converter, converting the 48V or 24V system voltage into a single board voltage, which powered a range of voltage regulators known as point-of-load converters. Intermediate bus voltage varies from application to application, and is chosen to reduce distribution power losses in copper traces and interfaces and to reduce power losses at the point-of-load when stepping down intermediate bus voltage to meet the load requirement. For small systems, designers tend to use a 5V bus voltage, prioritizing step-down optimization. In large systems designers will chose a 12V bus voltage to reduce power losses in distribution. In this IBA architecture, the IBC and point-of-load performance is limited to the intrinsic performance of each module, set by design-optimization during their development, resulting in un-optimized topology and unnecessary power losses when the payload is below optimal conditions. Recent datacenter studies show this situation exists 80% of the time. The advanced IBA Information and communication technology includes applications such as radio base stations, data storage, routers, and datacenters. These have different power demands and a fixed intermediate bus voltage is not the optimal solution to power systems that have large variations in their utilization from almost no traffic data to the limit of saturation. In response to the problem, Ericsson launched the first digitally controlled advance bus converter, the BMR453, in 2008. The converter is based on a digital core controller and an embedded communication interface complying with the power management bus standard, PMBus, and was the first advanced bus converter capable of real-time adjustment of the intermediate bus voltage in response to load variations. Ericsson then added the 20-Amp BMR450 and the 40-Amp BMR451 to its point-of-load converter product family. All enable system designers to precisely trim bus voltage to optimize performance in response to a varying load. Modeling performance Modeling power losses in a switching mode power supply is in theory not too complicated, and is represented by this equation: Ploss = PLoad_HS + PLoad_LS + PL_ESR + Pripple_LS + Pripple_HS + PESR + Pswitch In practice, it is much more complicated, so Ericsson decided to base its algorithm on a matrix of data measured from a set of devices. This allowed the company correlation measurements with simulation results. The study used one advance bus converter, a BMR453, to power two Ericsson 3E 20-Amp BMR450 and four 40-Amp BMR451 point-of-load voltage regulators. All parameters at different points of operation from no load to full load were measured. From the measurements and data collected, polynomial models were created using the least square fit model. Then the polynomial models were then used in the Simulink simulation system. Measured data By way of example, the results for one of the 20-Amp BMR450 modules used in this case study are shown in Figure 2. The output voltage was trimmed down to one volt, the load adjusted from zero load to 20-Amp full load, and the input bus voltage adjusted from 4.5 to 14 volts. Power losses across every point of operation were measured. The same procedure was conducted for all products, including the advance bus converter, BMR453. The data was entered into a master database to create a parametric model, which was then used in the simulation system. The Simulink model Polynomial models were created from the measured data then uploaded into the Simulink model summarized in Figure 3.
The model includes one advance bus converter BMR453 (represented in the top middle yellow box) converting a system voltage that varies from 36 to 75 volts, to an intermediate bus voltage, which powers the six points-of-load. Two 20-Amp BMR450 and four 40-Amp BMR451 converters are represented in the yellow boxes in the center of Figure 3. To dynamically control the intermediate bus voltage and to optimize system performance, an algorithm was run to collect the data used to create the simulation model. It also delivered instructions to the BMR453 to adjust the intermediate bus voltage to an optimum value for a certain load condition. Algorithm optimization The complex optimization algorithm contains a lot of sub-iterations. The initial sequence takes a snapshot reference of the system, usually during power-up, returning a power loss value that is defined in this model as P Loss zero. The algorithm is not limited to this function and could also monitor values such as power dissipation. When the reference is established, the first cycle starts, during which power loss is measured continuously. When the delta-P increases from the initial P Loss value, the intermediate bus voltage optimization sequence is initiated by sending a command to the advance bus converter. This triggers setting the bus voltage to an optimized value. When optimal P Loss is reached, the sequence closes. Once the first sequence has closed, the supervisor continues to monitor P Loss until delta-P varies again to initiate a new optimization trigger. This executes an optimization loop, until P Loss returns to the optimized value. In addition to monitoring P Loss, current is continually monitored to prevent over-current. This ensures that the intermediate bus voltage is always optimized to guarantee the proper voltage to the point-of-load. This is the general principle behind the optimization algorithm. The results Figure 4 is self-explanatory and shows the results of the system efficiency optimization under different load conditions.
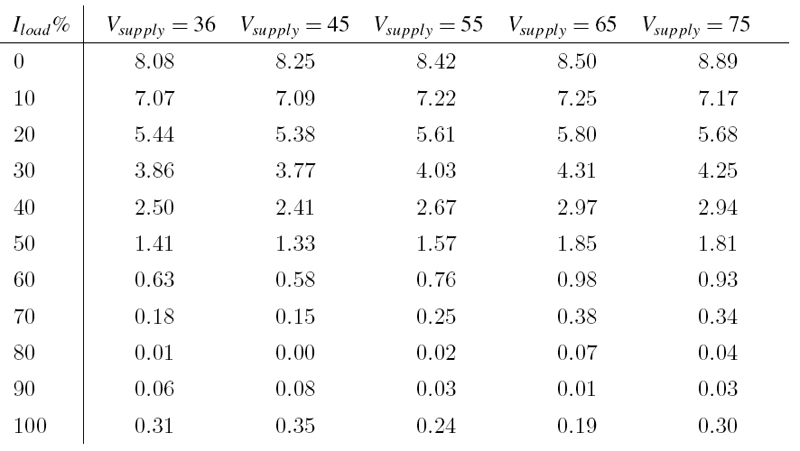
The orange line corresponds to the global system efficiency when the intermediate bus is fixed at 12V. The blue line corresponds to the global system efficiency when bus voltage is optimized to the load. Clearly, power losses are much higher at light load but still significant in the range of 30 to 50 percent where, on average over their lifetime, systems operate. Considering that the simulation represents a small application system, it's easy to imagine the direct benefit of such technology when deployed in larger scale systems, such as datacenters. Tables 1 and 2 show the result of the tests and simulations. They show the different areas of system operation and for each condition the optimized bus voltage and the resulting power loss reduction.
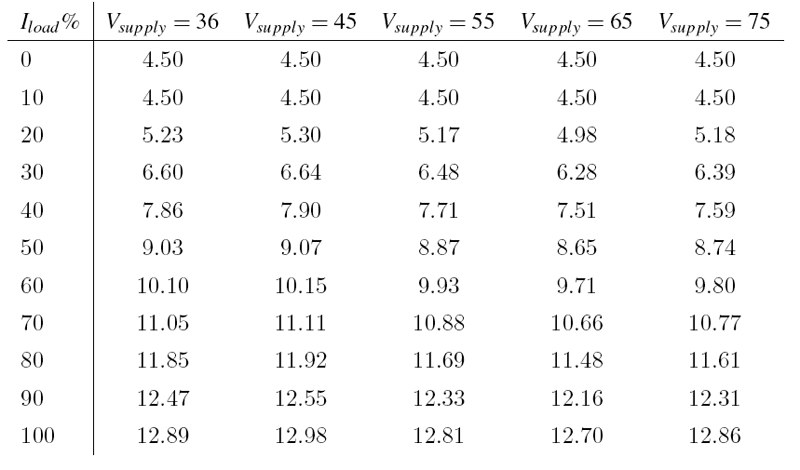
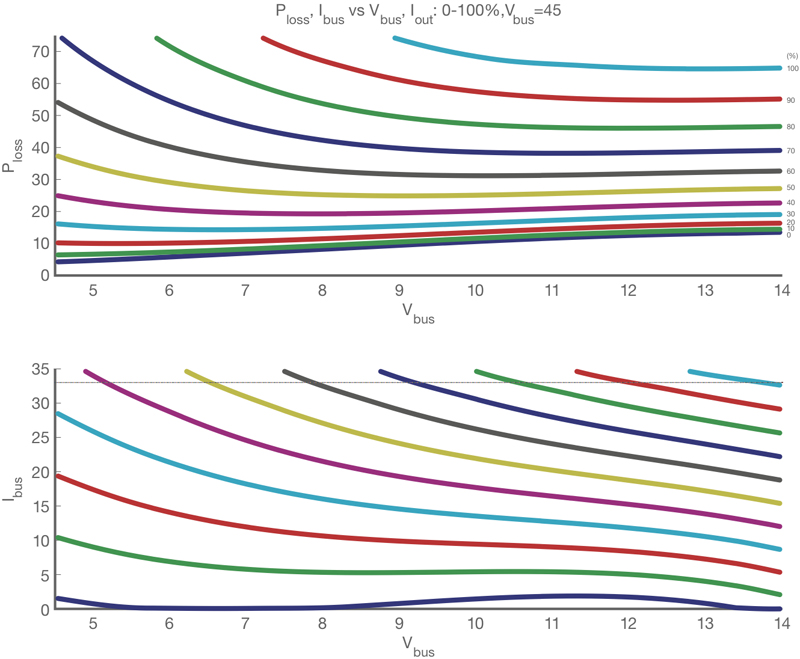
In the tables, the X-axis represents the system bus voltage powering the advance bus converter BMR453, which in this case study varies from 36 to 75 volts. The Y-axis is represents the percentage of the total load applied to the six points-of-load. This varies from 10 percent load to 100 percent load, which corresponds to full traffic data in peak time. Table 2 lists the optimized intermediate bus voltage for each point of the matrix system voltage versus load, whilst Table 1 lists the power saved when compared to a fixed 12V intermediate bus. As seen from the previous graph, the energy saving at low and medium load is impressive. Take for example a case where the input voltage is 45V, the system loaded at 30 percent of its full capacity and the intermediate bus voltage is optimized to 6.64V, then compare it to the same condition with a fixed 12V intermediate bus voltage. Table 1 shows that the energy saved is 3.77W and the same principle can be followed to visualize the energy saved when using an optimized bus voltage for a given load condition. 3.77W might not seem much but it adds up to a lot of energy when you consider the thousands of sub-systems embedded in datacenters. At 80 percent load, the point is reached where the 12V bus is appropriated and it's clear that increasing the bus voltage slightly at high load contributes to reducing the power losses a little. This demonstrates that the algorithm is still operating, even under these conditions. Under high load conditions, distribution losses are very much dependant upon layout and of the amount of copper implemented at board level. This case study hasn't taken account of losses resulting from voltage distribution but the algorithm could also be optimized to include such losses. It's also worth noting that when the system bus voltage varies between 36 and 75V at 60% of the load, the line saving is relatively minor but the algorithm is still operating and helping to save energy. This is because the BMR453 has integrated dead-time control and built-in efficiency optimization firmware to achieve this performance. Further results As already stated, in this case study based on Ericsson Power Modules' 3E digital power solution, because of the intrinsic auto-adaptive performance of the advance bus converter, the line variation of the system bus voltage has a very limited impact on global sub-system efficiency. Figure 5 shows curves related to power losses at several points of operation.
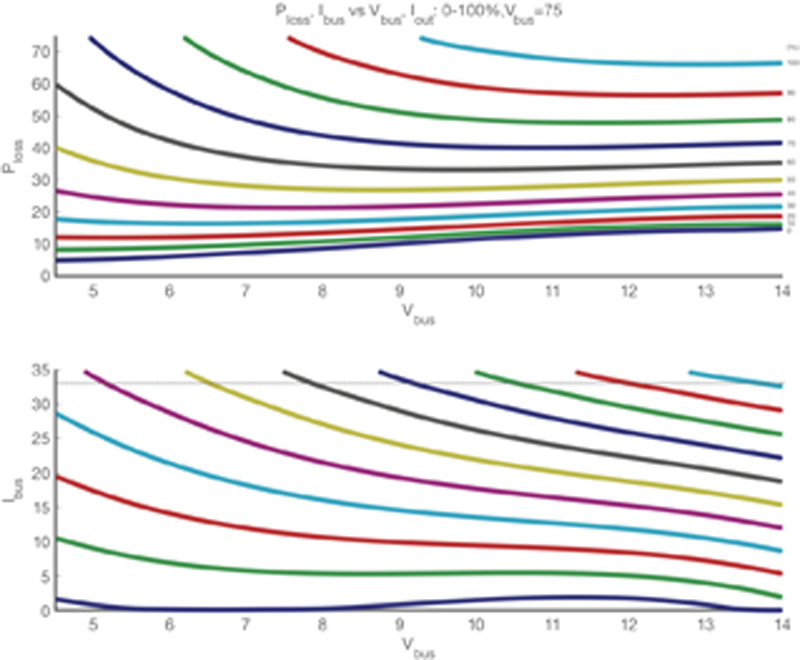
The chart in Figure 5a relates to a system bus voltage of 45V, and in Figure 5b to 75V. The upper graphs illustrate the total system power losses, identified as Ploss in the vertical axis, with the intermediate bus voltage, Vbus, represented in the horizontal axis. The output load has been adjusted from a very low load condition to full load, and each curve reflects the power losses at the defined load condition specified at the right-hand end of each curve. The lower diagrams show input current at system bus level. In the vertical axis is the value of the system bus current, Ibus, when the horizontal axis represents intermediate bus voltage, Vbus. The upper plots the input system bus current at the same load conditions from low load to full load. The top graphs show negligible differences between the curves and the optimized power loss points and are the same, regardless of system bus voltage. The upper graph confirms that the power losses are reduced to their minimum when the intermediate bus voltage is optimized. This results in a lower bus voltage under low load conditions and a higher one when load increases to higher values. Summary Clearly, there are significant advantages in using a dynamic bus voltage, no least as a way to reduce energy consumption. This results in lower CO2 emissions, reduced energy bills, and lower total cost of ownership. This case study did not include distribution power losses but such losses could be easily added to the simulation model and adapted to a single board configuration. Although not demonstrated here, the algorithm is also able to manage load transients, for example when the traffic data-rate switches quickly from low to high. Another benefit of the algorithm is the ability to customize the trigger through different methods from fully integrated into the board power manager, running on its own without external interaction, to optimization controlled through a PMBus start-and-stop command or from a flag-controlled high/low load. Whatever the method is selected, optimization will save energy. www.ericsson.com/powermodules