Making better choices to optimize inductor selection
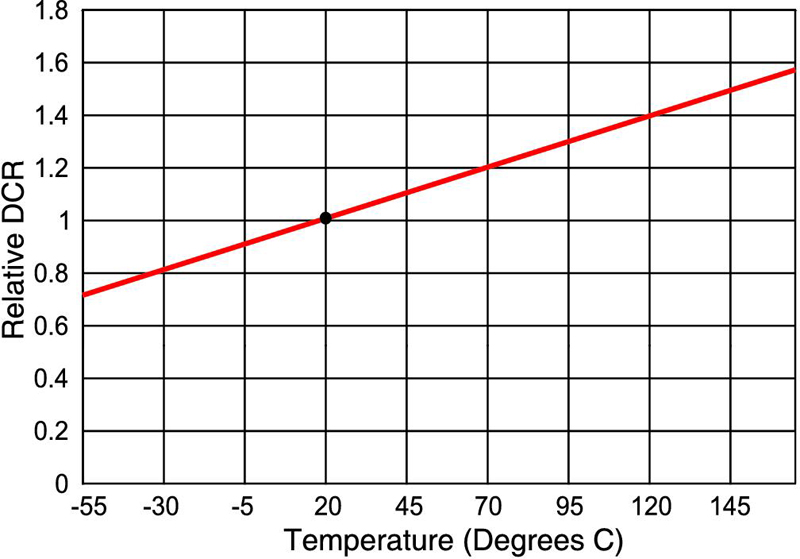
Optimizing a power converter means making the right inductor choice. Choosing an inductor is a fairly simple proposition, with relatively few parameters to consider. Yet a solid understanding of key inductor properties and specifications is necessary to achieve new levels of power efficiency without sacrificing other attributes. Here we discuss the implications of two key parameters: DCR and saturation current. In order to select an inductor it is necessary to consider specifications for both the average and the peak inductor current, as well as the difference between them. For example, a low voltage continuous mode buck converter is likely to have a large dc current with fairly small ripple, with a small difference between the peak current and the average current. Conversely the peak-to-average ratio in a discontinuous mode converter can be much greater. Since one inductor will not fit all situations, the designer must have access to properly detailed specifications to make the right choice for the application. Optimizing for DCR implies optimizing the design for the average current, whereas Isat means optimizing for the peak current. This leads to an important question: which balance is correct - better DCR or better Isat? For continuous operation of low voltage buck converters, the DCR is likely to be most important, whereas an emphasis on Isat may be more appropriate for situations like discontinuous mode and over current conditions. . DCR There are some subtleties to dealing with this seemingly simple parameter. The DCR is most generally used as a measure of conduction loss, as described by P = I2R. But let's take a look at the components of this equation. The �I' is the time-averaged current. Buck regulator current is likely to have a substantial dc component with a fairly small triangular shaped ripple current, in which case the average current is the rms value of this waveform, a value somewhere between the dc value and the peak of the triangle. For discontinuous current topologies the average current is proportional to the on time. The second part of the power equation, the DCR, seems straightforward - not particularly sensitive to measurement techniques, not frequency dependent, etc. However there are a couple things to consider. First, while DCR is not frequency dependent, it does have a temperature dependency based on the wire type. For typical annealed copper wire, the temperature dependence is quite linear and the temperature coefficient of resistance is about .00393 per °C and the relative resistance at any temperature T can be calculated compared to the resistance at 20°C according to: DCR = DCR20[1 + .00393(T-20)] . From this equation a derating curve for DCR [figure 1] can be constructed for any inductor with copper windings. A useful rule of thumb is to remember the DCR will change about 10% for every 15°C.
Second, consider the effective DCR, that is, the DCR of the inductor in situ when soldered on a PCB, which may be higher than the DCR of the data sheet due to solder joint resistance. This is true for any soldered component, but especially significant for current carrying power path components. Solder joints can add significant fractions of milliOhms to the series resistance of the power path . Considering 2x solder joint resistance per inductor, along with the resistance of PCB traces, at some point there will be diminishing returns to further lowering inductor DCR. Lower DCR will still help marginally improve power efficiency, but once this point is reached, the designer might do well to consider focusing elsewhere for larger gains. Why not simply look for the part with the absolute lowest DCR available? After all, even a small improvement in efficiency, is still an improvement. Even so, there is a cost. Optimizing DCR too far means a corresponding drop in Isat. These two key parameters are not directly connected but the properties that affect DCR often create design limitations for Isat and vice versa. Increasing the conductor (winding wire) diameter lowers DCR without affecting Isat. However, within a given inductor size, space is quickly used up and alternative means must be used for further DCR improvement. This can be accomplished by reducing the winding length through either a smaller number of turns or a smaller length per turn (core cross-sectional area). Both turn count and core cross-sectional area are inversely proportional to flux density; ?B= (E?T x 108)/NA, therefore reducing DCR by decreasing either the number of turns or core area causes the core to reach saturation flux density at lower current and reduces the Isat rating of the inductor. A significant part of the design task is to strike the right balance between optimizing for DCR versus optimizing for Isat. Isat Isat considerations start with how saturation is defined. It is convenient to define saturation as a percent drop in the inductance. For example, a 10% inductance drop definition is very conservative and insures very little inductance variation from zero current to the Isat rating. It is also common to see inductance defined by a 20% or 30% inductance drop, which is helpful if the design can tolerate a wider range of inductance. This simple definition of inductor saturation is quite useful for part to part comparisons, but since Isat rating is directly related to inductor size, operating farther along the saturation curve allows selection of a physically smaller inductor. Therefore more information is necessary to select the inductor that best optimizes both size and performance. Consider the physical nature of the inductance drop caused by saturation.
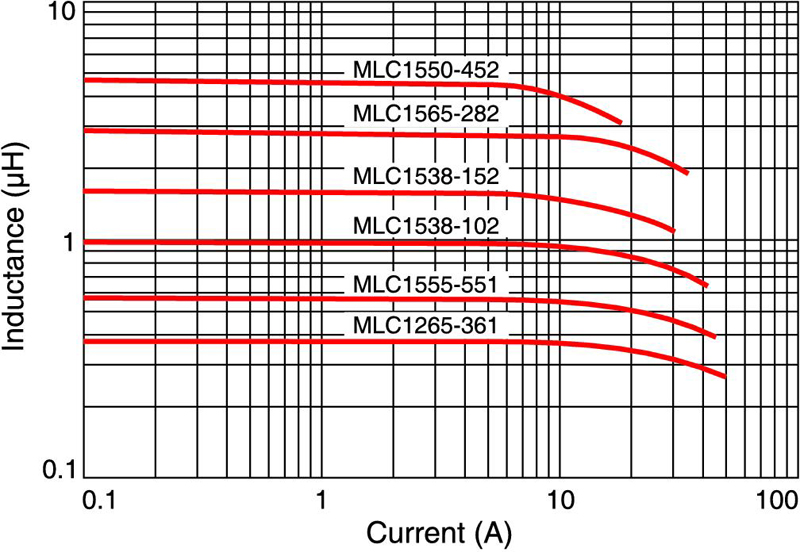
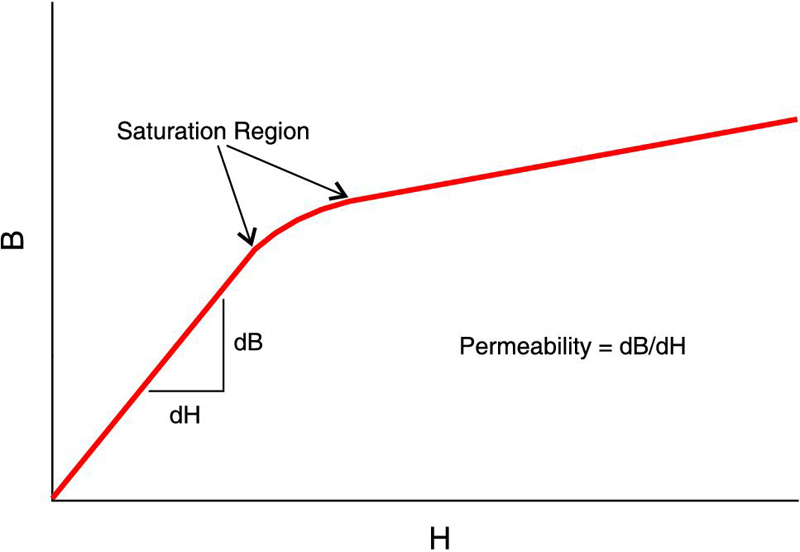
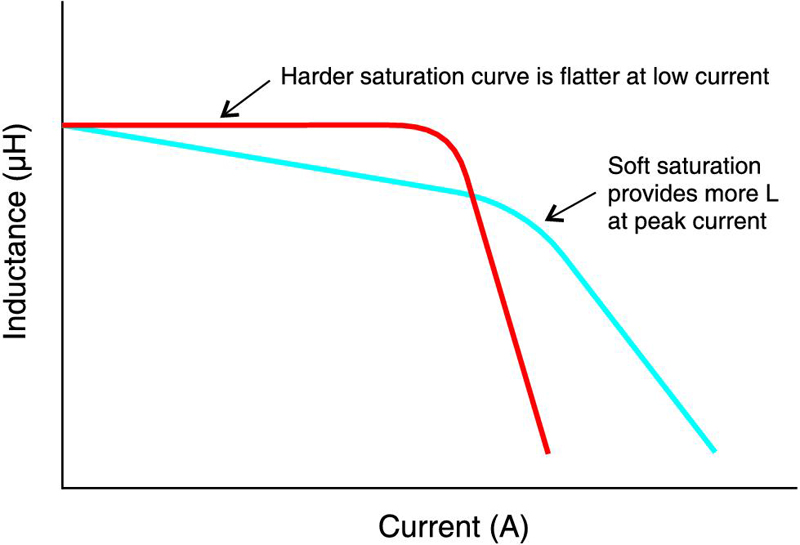
Core permeability, and inductance, are proportional to the slope of the B-H curve, so when current (?H) becomes large enough, the flux density reaches the saturation flux limit of the core (Bsat), the incremental slope of the B-H curve decreases, and so does the inductance. The important thing to note for selecting an inductor is that permeability and inductance do not drop instantly to zero as Bsat is reached. The bend in the B-H curve is a region, not a single point It can be seen from this discussion that Isat listed on a data sheet is primarily informational and should not be regarded as a fixed rating or limit. In fact, exceeding the saturation limit of a power inductor causes no damage to the inductor. Establishing a number for Isat allows meaningful comparisons, but too often that number becomes a de facto limit that designers are hesitant to exceed. Since saturation is not completely described by a single point definition, the designer should refer to L-I curves to get the most complete understanding of the saturation characteristic. Curves for a typical power inductor family [figure 3] show a more complete picture of the L vs I characteristic over a wide range of current. Different core materials, core shape, and air gap all have an effect on the shape of the saturation curve, so inductors with the same Isat "rating" may in fact have quite different saturating characteristics. Some inductors saturate quickly and others saturate more "softly". Softer saturation provides more inductance at the peak current at the expense of inductance stability at lower currents. Figure 4 demonstrates in more detail the possible differences between different inductor styles.
Summary It is to be expected that a variety of inductor types are needed to meet the needs of present and future power converter applications. Optimizing for any particular parameter ultimately leads to a compromise of another. Understanding the key inductor parameters of DCR and Isat in greater depth enables the designer to make the selection that best suits the size and performance needs of each application. www.coilcraft.com