Transforming into the digital utility
Six steps to implementing effective asset analytics
Consider this near-perfect storm: Many utilities in the United States have some part of their infrastructure that is more than 50 years old and long past its predicted useful life. In addition, many utility workers are aging and approaching retirement, which means they will soon end their careers and take with them their knowledge about utility assets. Regulators are requiring utilities to integrate more renewable energy and distributed energy resources such as solar panels, wind turbines, and devices to support increasing demand and improve energy efficiency, while threats to assets from cybercrime are rising.
Recent storm events and ongoing droughts also place stress on assets, eventually resulting in brown outs and black outs. Utilities have invested in smart infrastructure over the past 25 years and continue to invest aggressively, while consumers are adding more energy demanding loads such as EVs and home electronics. Utilities also see a host of opportunities, each of which brings its own challenges.
Distributed and renewable generation can take the strain off aging central power generation stations and reduce carbon emissions, but renewables also pose challenges for transmission siting, management of the transmission and distribution grid, and overall reliability. Electric vehicles offer the possibility of increased revenue as electricity replaces gasoline, plus the ability to interact with the grid to store or share energy, but their heavy loads also can place additional strain on portions of the distribution network.
Demand response and energy efficiency programs help to reduce overall consumption and lower peak demand, but they also can lower revenues. Devices associated with demand response and energy efficiency generate additional streams of data that utilities need to manage, integrate, and analyze.
These challenges and opportunities bring additional complexity and hence risk to utility operations. Many of these changes are not isolated or one-time events. Rather, they are all long-standing, continual and interacting trends in economics, demographics, politics and the environment. None show signs of slowing down or reversing (See Figure 1).

Click image to enlarge
Figure 1: Challenges and opportunities bring additional complexity and hence risk to utility operations
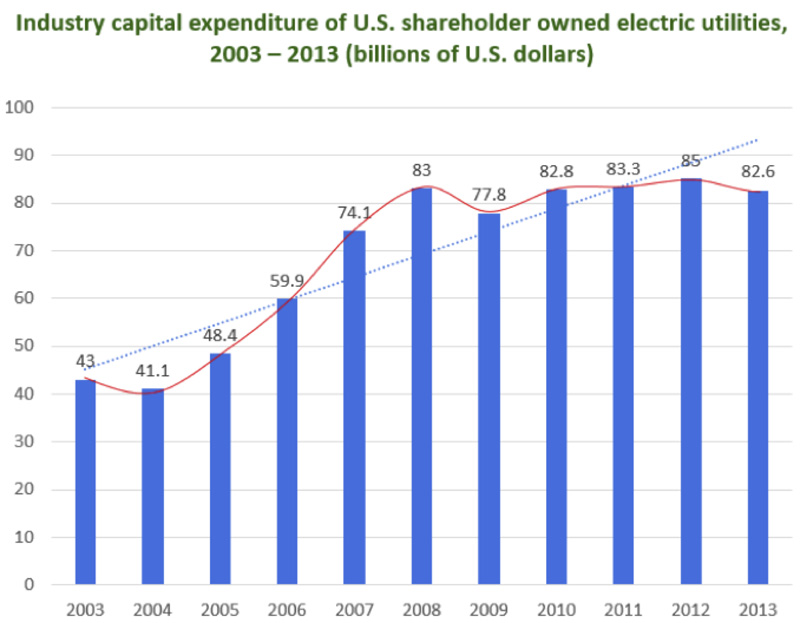
As these trends continue their 24/7/365 climb, many utilities are still trying to manage their assets using static analysis of historical data. A quarterly report on transformer fleet status that’s already ten weeks old does little to help inform decisions when a major snow storm is predicted for the day after tomorrow. It does even less to help justify the next rate case or municipal bond offering needed to finance utility responses to the challenges and opportunities (see Figure 2).
Click image to enlarge
Figure 2: Industry capital expenditure of US shareholder-owned utilities (Source: Statista.com)
Looking at the totality of this near-perfect storm, utilities need a way to manage and apply the large amounts of data already at their disposal to mitigate the complexity and thus risk inherent in a network of aging assets that continues to grow in complexity. Plus, they need to be able to do this in a capital-efficient manner.
There are six steps that utilities can pursue to apply cutting-edge analytics and visualizations to existing data and move into the digital age of asset analytics.
Step 1: Understand asset and CAPEX challenges
Between 2003 and 2013, capital expenditures (CAPEX) for utilities in the United States nearly doubled, from $43 billion per year to more than $82 billion per year. Physical assets form the bulk of CAPEX spending for utilities. To deploy these expenditures and resulting assets in a more effective way, regulators, shareholders, utility executives, and ratepayers have increased their attention on CAPEX.
This means that justifying, planning, and allocating CAPEX more effectively has become and will remain crucial. Even a one- to five-percent improvement can lead to significant gains in return on investment and the overall effectiveness of CAPEX.
At the same time as cost of operations and CAPEX is rising, there is downward pressure on utility rates and revenues lowering margins. Energy efficiency, demand response and distributed generation take away load from central generation and distribution, which decreases utility revenues. To keep expenses in line with revenues, utilities need to become more analytical and predictive in choosing how to spend CAPEX. Rather than rely on static, historical analysis to guide CAPEX spending, utilities need to dedicate expenditures to either mitigating risks or taking advantage of opportunities.
To manage the complexity of and hence the risk to their operations, utilities need continuous visibility into asset function with contextual analytics that include normalized metrics. With this in place, predictive analytics can then guide asset decisions to provide impact analysis related to CAPEX spending and asset criticality. Knowing not just what conditions are today, but what conditions may be tomorrow, gives a better understand of the overall risk to the fleet of assets.
Step 2: Assess the metrics used for CAPEX decisions
For CAPEX decisions related to assets, utilities have relied, and continue to rely, on asset measures such as SAIDI, SAIFI, load, asset age, depreciation, and ROI/ROE. These static measures are necessary but no longer sufficient for utility management. They can give information about what happened to a failed asset, and maybe a bit about why it happened. But, these metrics don’t tell indicate where on the network an event happened, or when it happened in relation to other events, what impact the event had or who last worked on a particular asset.
Going forward, for effective CAPEX planning, utilities need to know when an unwanted event might happen again, where it might happen, what impact it might have and possible mitigation plans to avoid the event being repeated in the future.
Utilities need more leading indicators, ways to move to continuous visibility and predicative capabilities related to assets. With the growing fluidity of the utility environment, the potential for reliability issues or cost shifting grows. Being able to consistently predict and assess risk becomes important for effective CAPEX planning and deployment.
Step 3: Analyze current system and process gaps
How do utilities move towards continuous and predictive analytics?
First, utilities need to inventory existing systems and tools used for asset analysis. How do current tools and systems take advantage of the available data to support continuous analysis and prediction? Does the staff have the necessary skills to perform continuous and predicative analysis?
During this inventory, utilities need to look not just at the local or department level, but also at the enterprise level that cuts across departments. Much of a utility’s systems and data reside at a departmental level, but need to be brought together to give a complete picture of current and potential asset conditions (see Figure 3).

Click image to enlarge
Figure 3: Much of a utility’s systems and data need to be brought together to give a complete picture
The good news is that utilities can move towards continuous and predictive analysis in achievable, incremental steps. There’s no need to wait for all available data to be accessible and perfect. Begin by identifying use cases that take advantage of existing data, to start learning and employing new tools and processes and notching some early wins.
Step 4: Identify needs for better capital decisions
New and existing metrics, tools, systems, processes, and skills should support asking and answering real-life questions related to assets and CAPEX planning. Questions can be directed at an asset level, such as,
• How critical is this asset?
• What are the consequence if it fails?
• Should I repair or replace it?
Questions can also span across asset classes to take a fleet-wide view.
• How do I trade off CAPEX across asset classes?
• What will my asset fleet look like 10, 20 and 30 years from now?
• How do I justify new CAPEX in my next rate case or bond offering?
Different utility roles—engineering, finance, business analysis, senior management—may have different questions or different priorities related to the same question.
Step 5: Apply asset analytics to CAPEX decisions
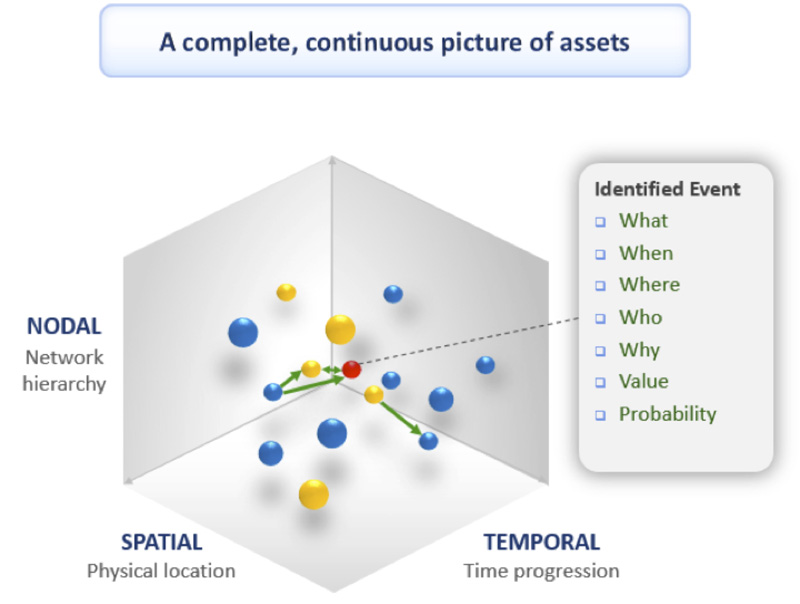
To fully understand an asset on a network and thus answer these important, real-life questions, utilities must document many aspects of the asset: the location that an asset occupies both physically and on the network, the asset’s performance over time and its particular history and operational characteristics. Space-Time Insight calls this spatial-temporal-nodal analytics. The software uses these characteristics to perform analytical calculations of metrics such as asset health index, criticality, risk, and probability of failure (see Figure 4).
Click image to enlarge
Figure 4: Spatial-temporal-nodal analytics can perform analytical calculations of metrics
Take asset risk for example; by continuously computing the risk for all the assets across the network, Space-Time Insight helps utilities build a comprehensive view into the current state and level of risk in assets and networks.
Having such a metric associated to assets and asset classes allows utilities to perform what-if scenarios and calculations to understand the impact of various CAPEX strategies.
With in-depth and continuous analytics, utilities can build probabilistic models about what may happen to assets and the resulting impact. Through machine learning, computers can come to recognize past patterns and apply that pattern recognition to current and future conditions. When utilities have this level of broad, deep and ongoing analysis, they gain a much more detailed and useful view into the criticality of assets, the financial impact of asset performance and CAPEX decisions, and the operational characteristics of the network itself.
This level of specificity allows utilities to make much more credible arguments for rate cases, municipal bond offerings, and other funding requests.
Step 6: Continuously improve CAPEX justification, planning and allocation decisions
Continuous and predictive analysis lays the foundation for utilities to improve CAPEX evaluations and decisions. This is more than just a nice-to-have or best practice, but nearly a necessity.
Regulatory environment, technology, weather, demographics and other influences are continuously evolving, which means the utility environment is continuously evolving. Analytics and predictions must also continue to evolve.