Optimizing Data Center Intermediate Bus Voltage for Significant System Efficiency Improvements
Keeping a cap on data center energy costs is increasingly difficult, with exponentially increasing traffic and the cost of electricity at all-time highs
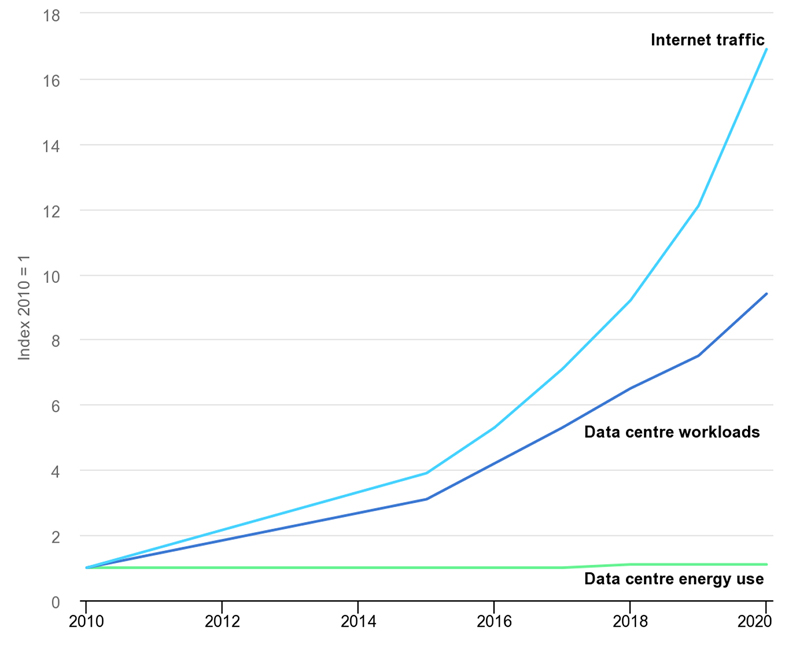
Figure 1: Data center energy use has stayed flat even with exponential traffic increase. Source: IEA
While system designers have worked to get more data throughput without proportionally increasing power draw, there has been equal pressure to squeeze better efficiency out of the power delivery system, to reduce losses, consequent costs and cooling system overhead. Power converter designers have responded with ever-more efficient products, and it’s remarkable that even though center workloads have increased around 10x since 2010, energy use to 2020 stayed largely flat (Figure 1).
However, incremental gains in power conversion hardware efficiency are becoming harder to find and as a result, energy use and its cost are set to start to follow the exponential traffic trend, with significant financial implications.
There is another lever to pull
While power converters are converging on 95%+ efficiency figures, with synchronous rectifiers and resonant topologies commonly being used for example, there is still another lever to pull – the shape of the efficiency curve with different combinations of input and output voltage and load current. This can never be flat (it’s zero at no load!) and it must tail off at some high load where I2R losses start to dominate, so the converter designer has a choice of where to make it peak, perhaps at full load? Or maybe an assumed typical load? The problem is that the designer does not necessarily know what load derating, if any, the system architect has built in, what input voltage might be applied and what output voltage might be set, if adjustable. Further, other converters in the power chain, perhaps from different manufacturers, almost certainly have peak efficiency at different set voltages and loads.
When it comes to efficiency of the power system, the target might be moving (different load, input/output voltage) but the goal is to create a high efficiency in any point.
Why efficiency varies with input/output voltage ratio
It’s worth just considering how and why efficiency of a typical power converter varies. In data center DC distribution systems, there are ‘bus’ converters, down-converting a higher, variable voltage perhaps 40-60V, to a regulated 12V, feeding non-isolated ‘Point of Load’ (PoL) converters that provide the final voltage to end-loads, often sub-1V.
The transformer in a bus converter handles the basic scaling of the output, but to handle a wide input variation, the switch duty cycle must vary in the same proportion. In the bridge circuits typically used this means a variation in individual switch duty cycle from a little under 50% to less than 25% to allow for tolerance, voltage surges and ‘dead time’. At low line and maximum duty cycle, average and RMS currents are high with increased I2R losses in switch channels, magnetics windings and interconnections. At high input and minimum duty cycle, average current is lower than at low line, with lower RMS values, but switching losses increase from charge and discharge of circuit and device capacitances at higher voltages. Also, peak current is constant at any duty cycle for constant power, so at high voltages, any current/voltage overlap on a switching edge produces higher dissipation. Ripple current and consequent dissipation in the ESR of input/output capacitors is also highest at high line, where for example, 25% duty cycle from each of two legs of a bridge amounts to only 50% conduction time of input current, representing high capacitor ripple current. At low line, the overall effective duty cycle is close to 100% or DC, with little ripple current and lower ESR losses.
Point of Load converters can have extreme conversion ratios
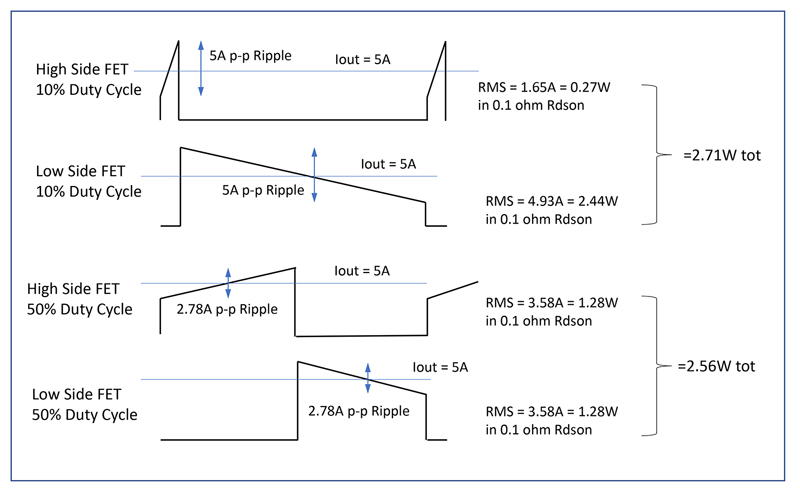
Non-isolated Point of Load converters (or Voltage Regulator Modules) are subject to similar variation in efficiency with load and voltage conversion ratio, except the situation is often more extreme with 10:1 ratio not uncommon, such as from 12V to 1.2V or 10% operating duty cycle. With ripple current set very low, the combined losses in high and low side switches are at a maximum at 50% duty cycle if they have the same on-resistance. However, it is common to allow the inductor peak-to-peak ripple current to be high, perhaps 50% of load current for better loop response and smaller size. This adds relatively more to conduction losses at high conversion ratios tending to ‘flatten’ the efficiency curve. Figure 2 is an example. Low side switches might be chosen with a lower on-resistance for some benefit. In the example of Figure 2, if the low side FET were 50 instead of 100 milliohms, this would relatively reduce the losses at high duty cycle, which can again be used to shape the efficiency curve.
Click image to enlarge
Figure 2: Example current waveforms in PoL switches at different duty cycles corresponding to high and low input voltages at fixed output voltage, 5A load and 5A pp ripple at 10% duty cycle
Multiple factors affect the shape of the efficiency curve
Other factors affect the shape of the efficiency curve of bus and PoL converters under different conditions, such as losses in magnetics and in body-diodes during reverse recovery, so the conditions for peak efficiency are complex to determine. This means that practically, converter manufacturers will measure actual values and provide plots, or provide simulation tools such as the FLEX Power Designer software.
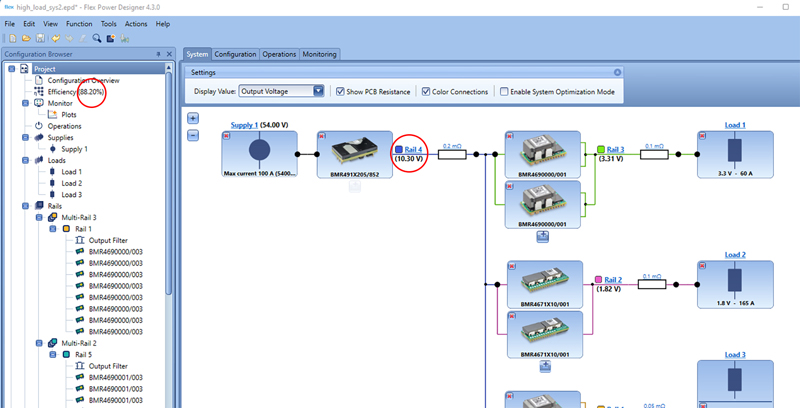
In a distributed DC bus system, the input is set by external factors and the final PoL output voltage is what the load requires, but the intermediate voltage, typically 12V, could be varied to find a ‘sweet spot’ where overall efficiency is maximized for particular load conditions. To facilitate this, modern regulated intermediate bus converters can be dynamically programmed, usually by a PMBus over some range. As an example, FLEX Power Designer was set to use a FLEX Power modules BMR491 bus converter at 12V output feeding BMR467/469 PoLs with a load of 1100W on the BMR491, about 1000W load on the PoLs. The software shows an overall efficiency of 88.25%. If the intermediate bus voltage is reduced to 10.3V, efficiency changes by a negligible 0.05% (Figure 3). If the BMR491 output were set to 8V to try to find a significant increase in efficiency, as the PoLs appear as constant power devices, the output current increases to 137.5A, far over the BMR491 maximum continuous rating of 108.3A.
Click image to enlarge
Figure 3: Screenshot of FLEX Power Designer software showing system efficiency with selected bus voltage
If we now consider a lighter load condition of 440W, the software calculates an efficiency of 86.7% at 12V, 87.6% at 10.3V and 88.45% at 8V, a significant saving of 1.72% at the lowest voltage. At 8V and 440W, the current is 55A, well within the BMR491 rating. Clearly under these lighter load conditions, it is advantageous to reduce the intermediate bus voltage and with PMBus® control, this can be done dynamically, as the BMR491 ‘knows’ its output current and can pass this to an external controller which can respond with an instruction to reduce bus voltage. In more advanced systems, even the PoL / VRM’s can provide real-time data to the external controller for further finetuning.
Loads can change rapidly
However, loads can ramp up and down very rapidly as processing demand changes, so there is a real possibility that if the bus voltage is set low with a light load, to improve efficiency, the load could suddenly increase to maximum. Until the BMR491 and its controller react to increase voltage, there will be a short time while the voltage is low and current higher than the converter continuous rating. The BMR491 copes with this situation as it has a surge load rating of 1850W or 155A peak, so our example of 1100W full load with 8V output producing 137.5A is easily met for short periods.
All surge periods are not the same in the industry. Some are shorter than others. To practically be useful, surge periods of >100msec are recommended. Longer periods also reduce the requirement of controller speed and can reduce PMBus traffic.
Summary
Every fraction of a percentage point of efficiency savings is worthwhile and with knowledge of the detailed variation of efficiency of power converters with varying loads and set voltages, system ‘sweet-spots’ can be found where power loss is minimized. Products from FLEX Power Modules are fully characterized in the FLEX Power Designer software, so that users can ‘virtually’ explore operating conditions and then in the real world, control converter voltages dynamically through digital interfaces, to follow the high points in the efficiency curves.