Industry News
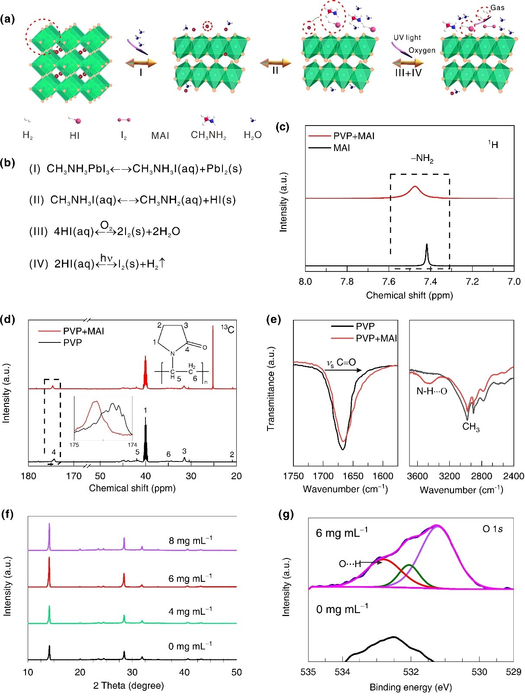
Fig. 1. Degradation of the perovskite material with moisture.


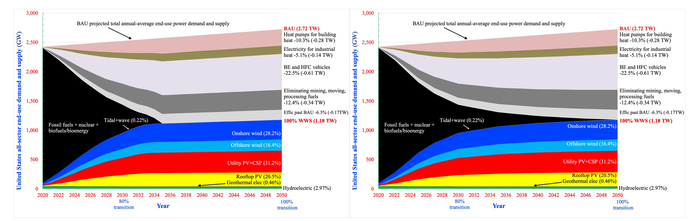
Graphs showing timeline of energy sources for meeting all U.S. energy needs with wind, water and solar (WWS) power sources. The graph on left shows mix for 80% WWS by 2030 and 100% by 2035. The graph on right shows mix for is 80% by 2030 and 100% by 2050. The 2050 end points in both cases are cases examined in the study.
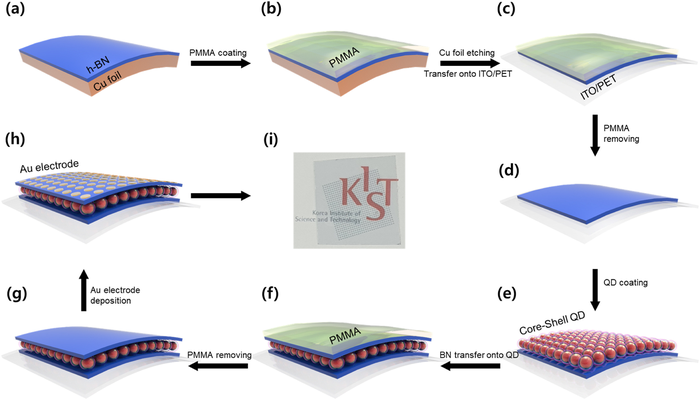
(a-c) hBN transfer to the ITO/PET substrate (d) hBN/ITO/PET substrate; (e) formation of QDs monolayer using a spin-coating technique; (f-g) hBN transfer to the QD/hBN/ITO/PET substrate (h) Au electrode deposition on hBN/QD/hBN/ITO/PET by using a thermal evaporation process; (i) photographs of the device.
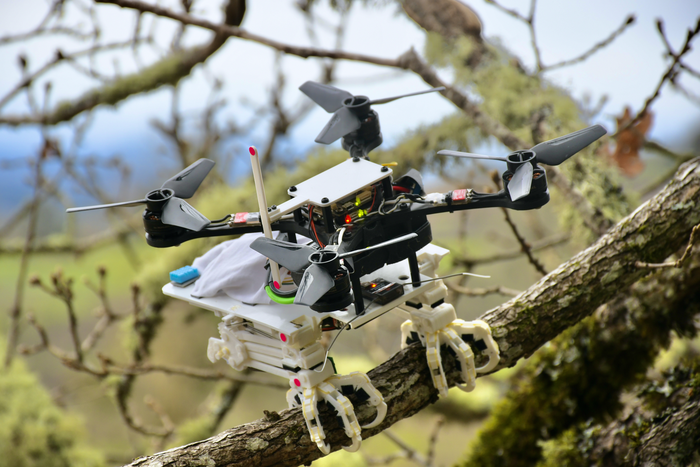
The grasping robot that Stanford engineers developed based on studies of birds.

The University of Oxford
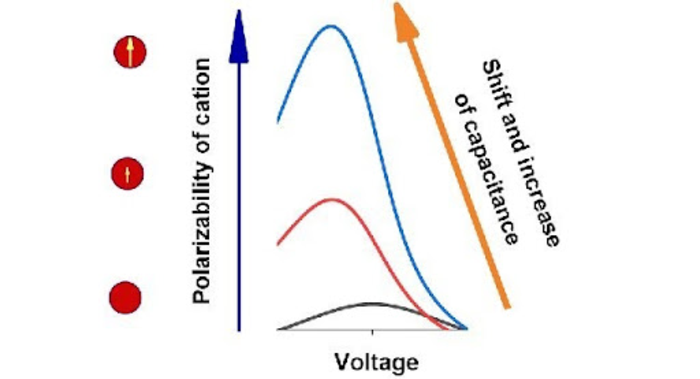
Growth of polarizability or permanent dipole moment of cations leads to considerable growth of differential capacitance

 - small.jpg)