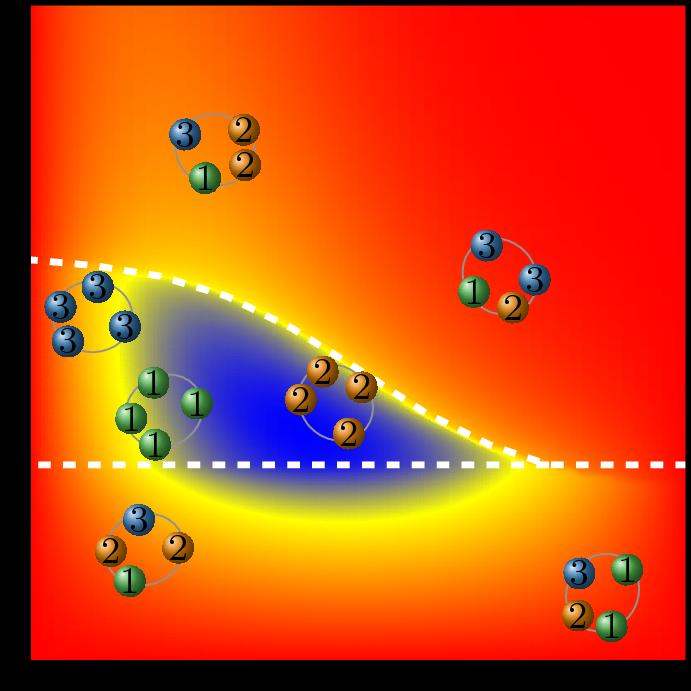
Density plot of the power output of an energy-converting network that consists of interacting nano-machines illustrated by the spheres. The power increases from red to blue color, thus in the synchronization phase corresponding to the area enclosed by the white dashed lines, the output of the network is maximized.