Due to residual fossil fuel emissions that would remain even with very stringent climate policies enacted from 2020 on, so-called negative emission technologies to remove carbon dioxide from the atmosphere will be necessary to comply with the 1.5°C limit.

Vassilis Kekatos
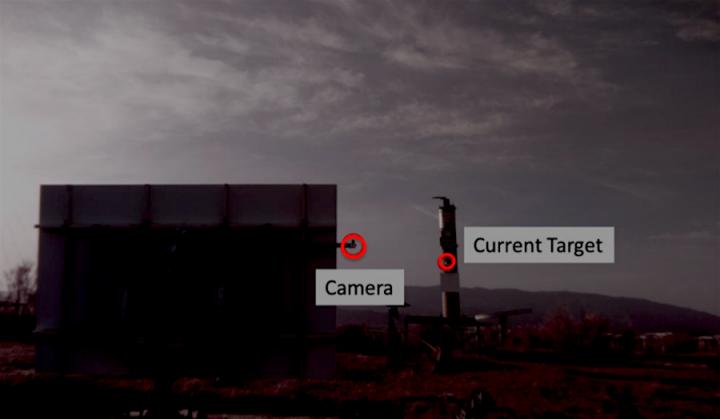
A digital camera mounted experimentally on a sample heliostat 'sees' the infrared light on the tower
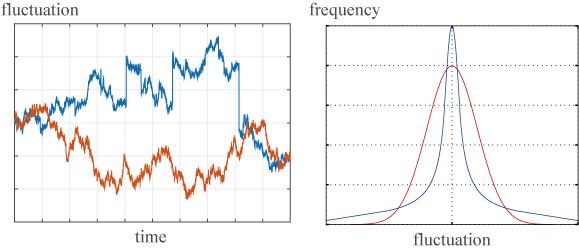
The left figure is an example of time series of fluctuation of power generation outputs. The right figure shows the histogram of the frequency of corresponding power fluctuation. When we can assume mild fluctuation as illustrated by the red line, modeling with normal distribution is acceptable. However, wind power generation fluctuation contains abrupt changes as illustrated by the blue line. Consequently, the corresponding histogram has slowly-decaying heavy tails, which represents the extremal outliers.
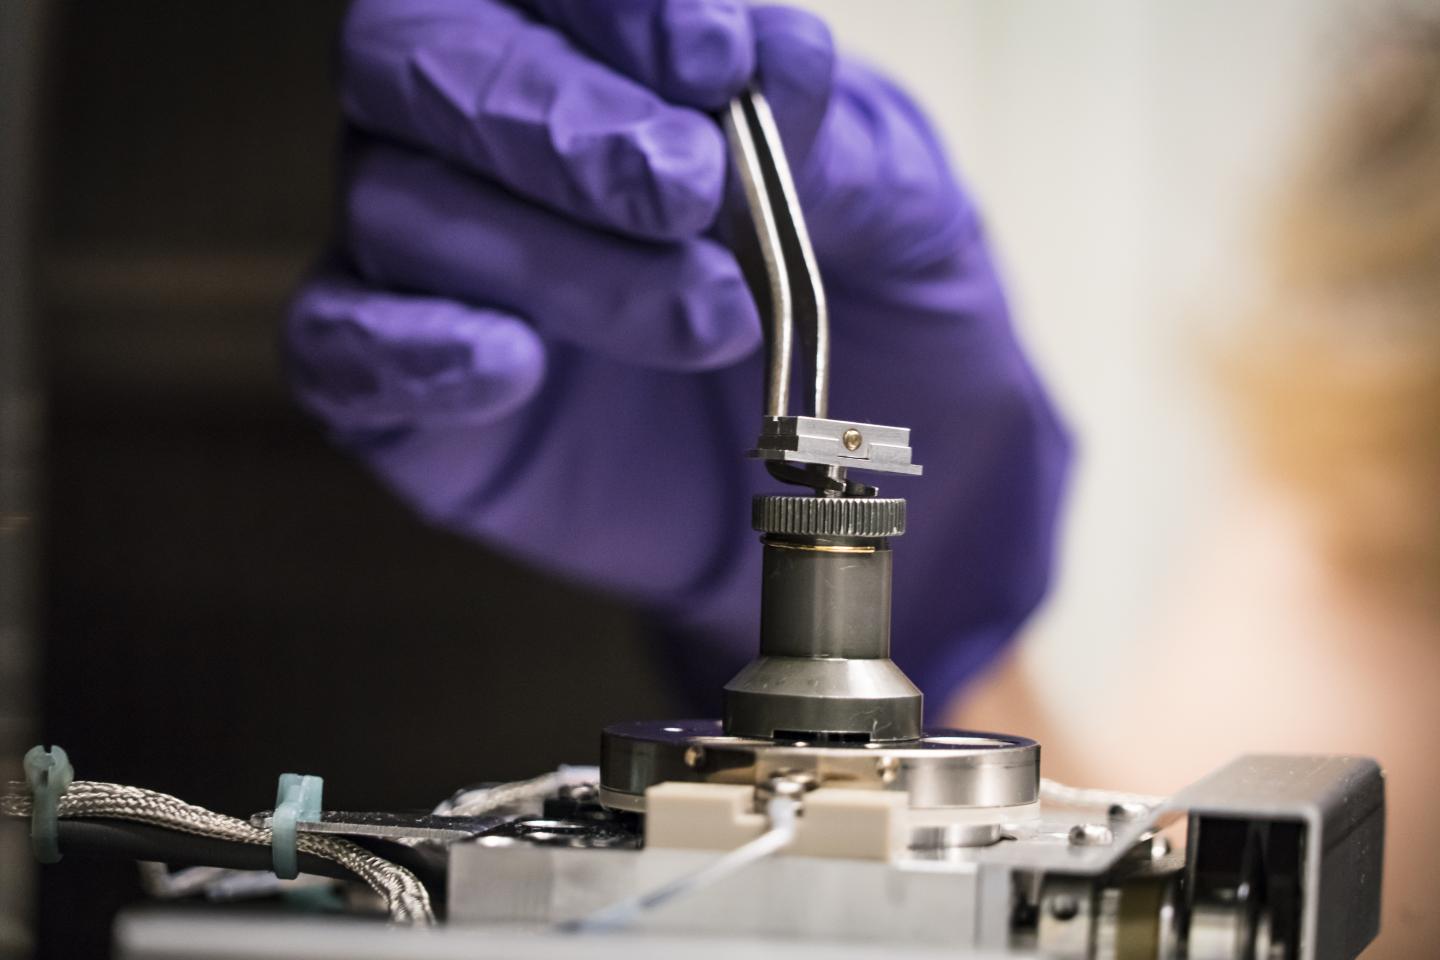
This is a sample holder inside a focus ion beam (FIB) milling microscope used to create thin foils for transmission electron microscopy (TEM) studies.
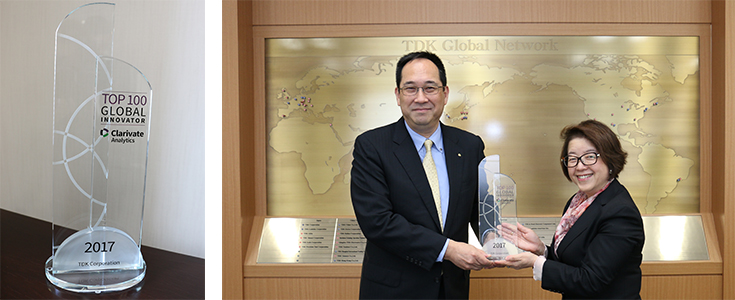
Shigenao Ishiguro, President and CEO of TDK Corporation, and Yoshiko Tanahashi, Director of Clarivate Analytics Japan


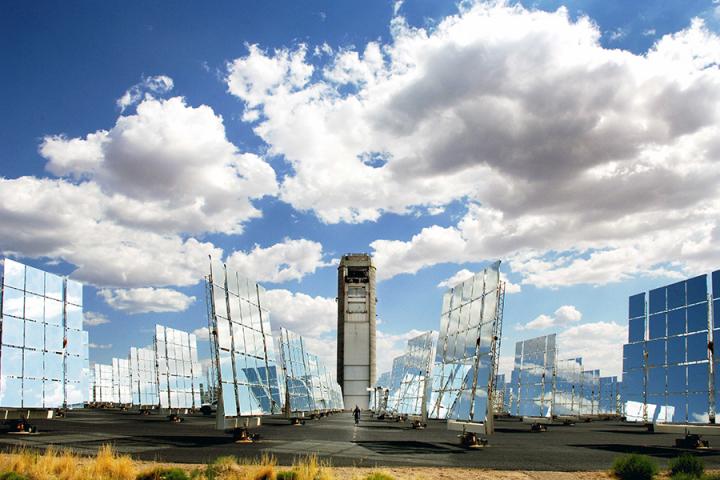
Three new solar thermal technologies, solid (particles), liquid (molten salts), and gas (sCO2) are to be combined with a Brayton power loop to bring down costs of solar towers; the future of 24-hour solar.


Mr. Ian Templeton, 2018 Acopian Power Supply Engineering Scholarship Winner


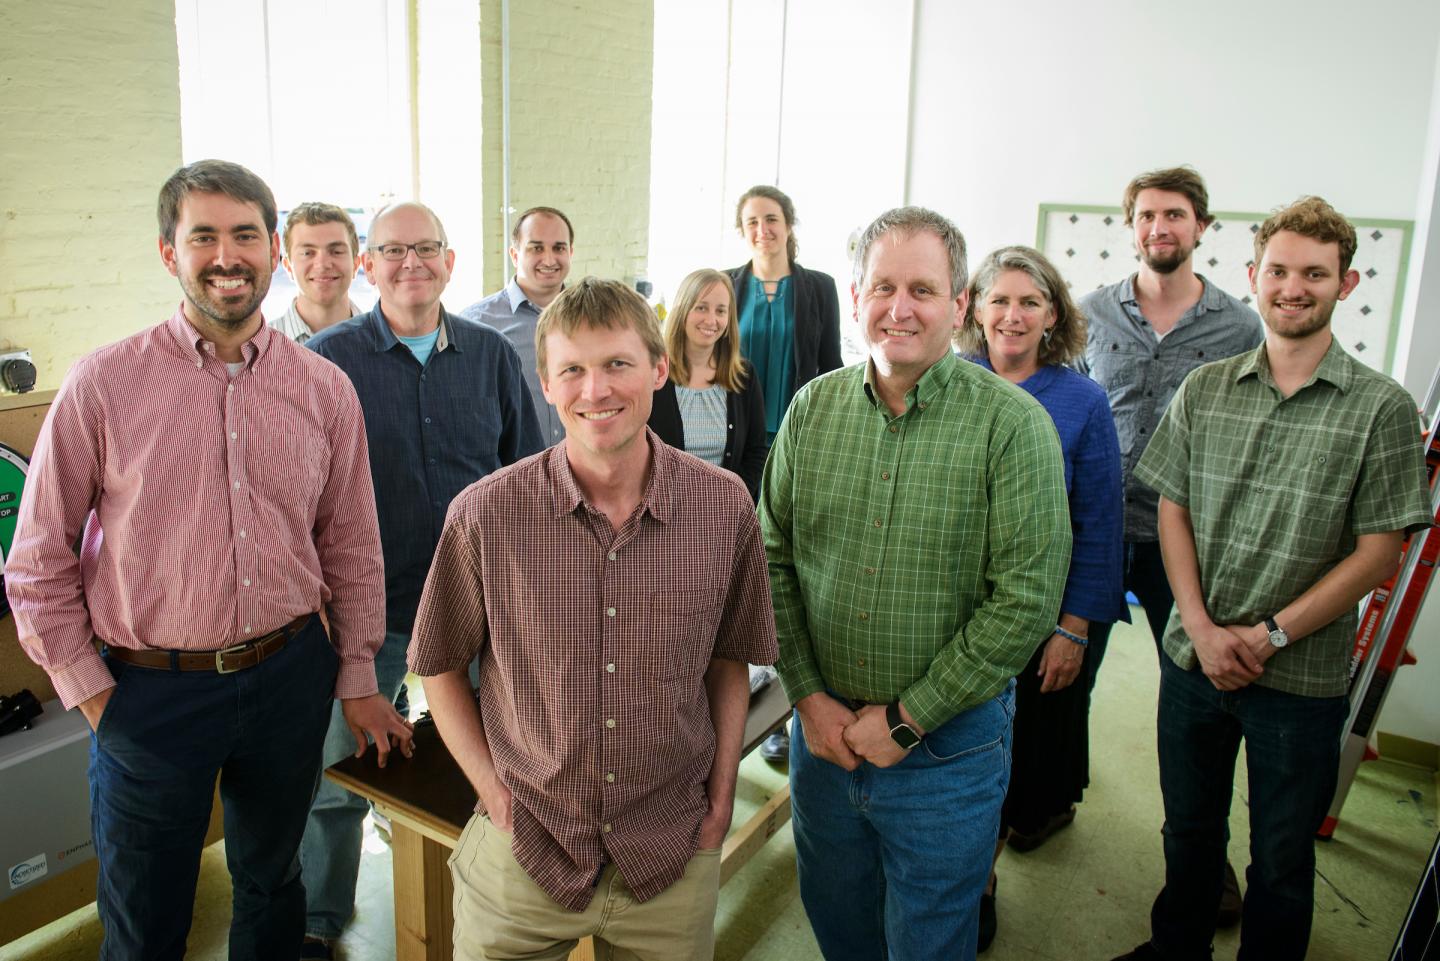
Energetic growth. The UVM spinoff company Packetized Energy is on a roll, adding staff, customers and business partners at an impressive clip. Surrounded by full and part-time staff in the company's new offices in Chace Mill are (left to right) faculty founders Mads Almassalkhi, Jeff Frolik and Paul Hines and new company CEO Scott Johnstone. The company's clever algorithms help utilities tap the potential of renewables like solar and wind.

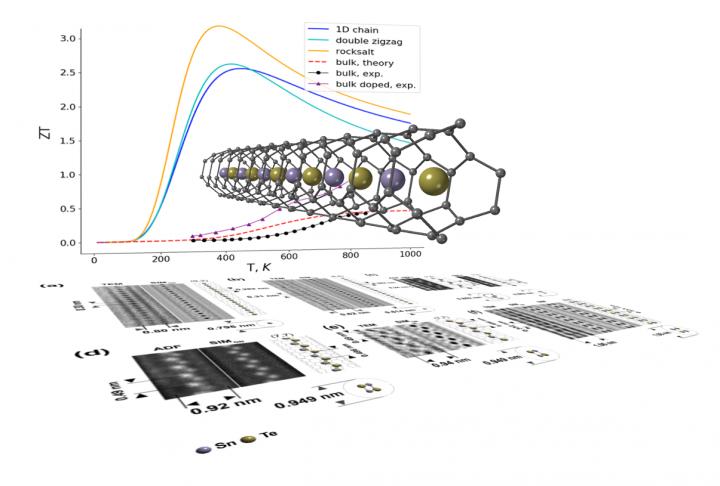
This is a diagram showing one-dimensional nanowires conducting waste heat to electricity.