Renewable Energy
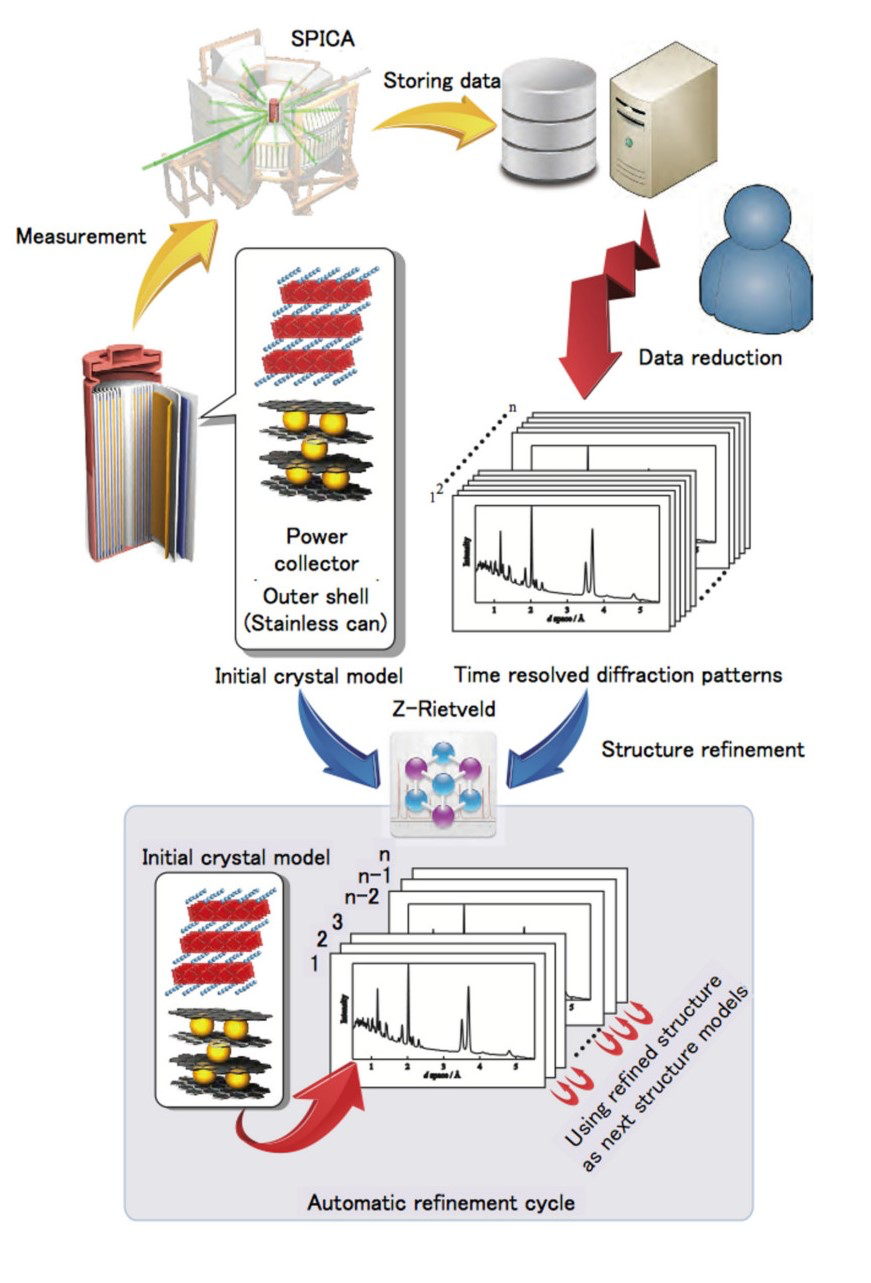
Top left: schematic diagram and cell environment for the in situ experiment using an 18650 cell in the SPICA diffractometer, with examples of the data analysis using the data analysis program developed in the present study. A schematic diagram shows the flow chart of the analysis process for the automatic refinement cycle.
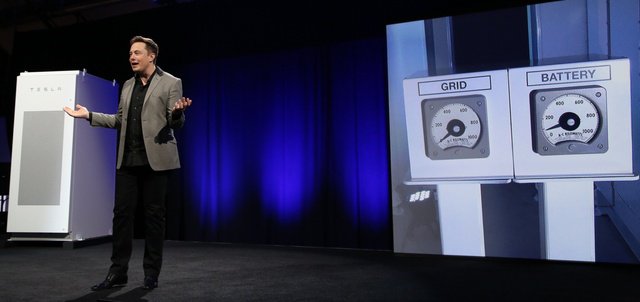
Tesla announced it has made an offer to buy SolarCity
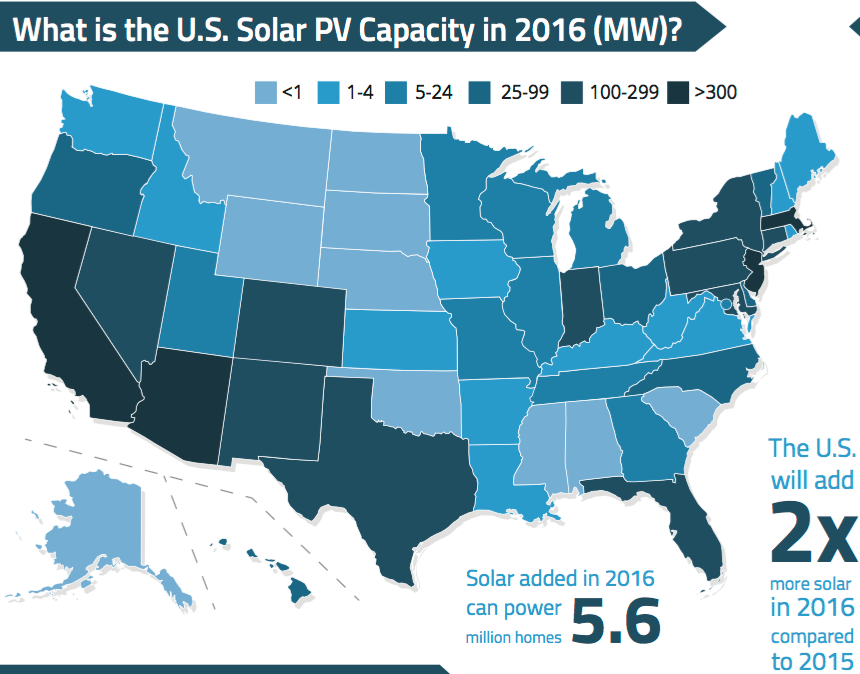
The U.S. is expected to add two times more solar in 2016 compared to 2015 thanks to declining PV technology costs, state programs, and federal incentives
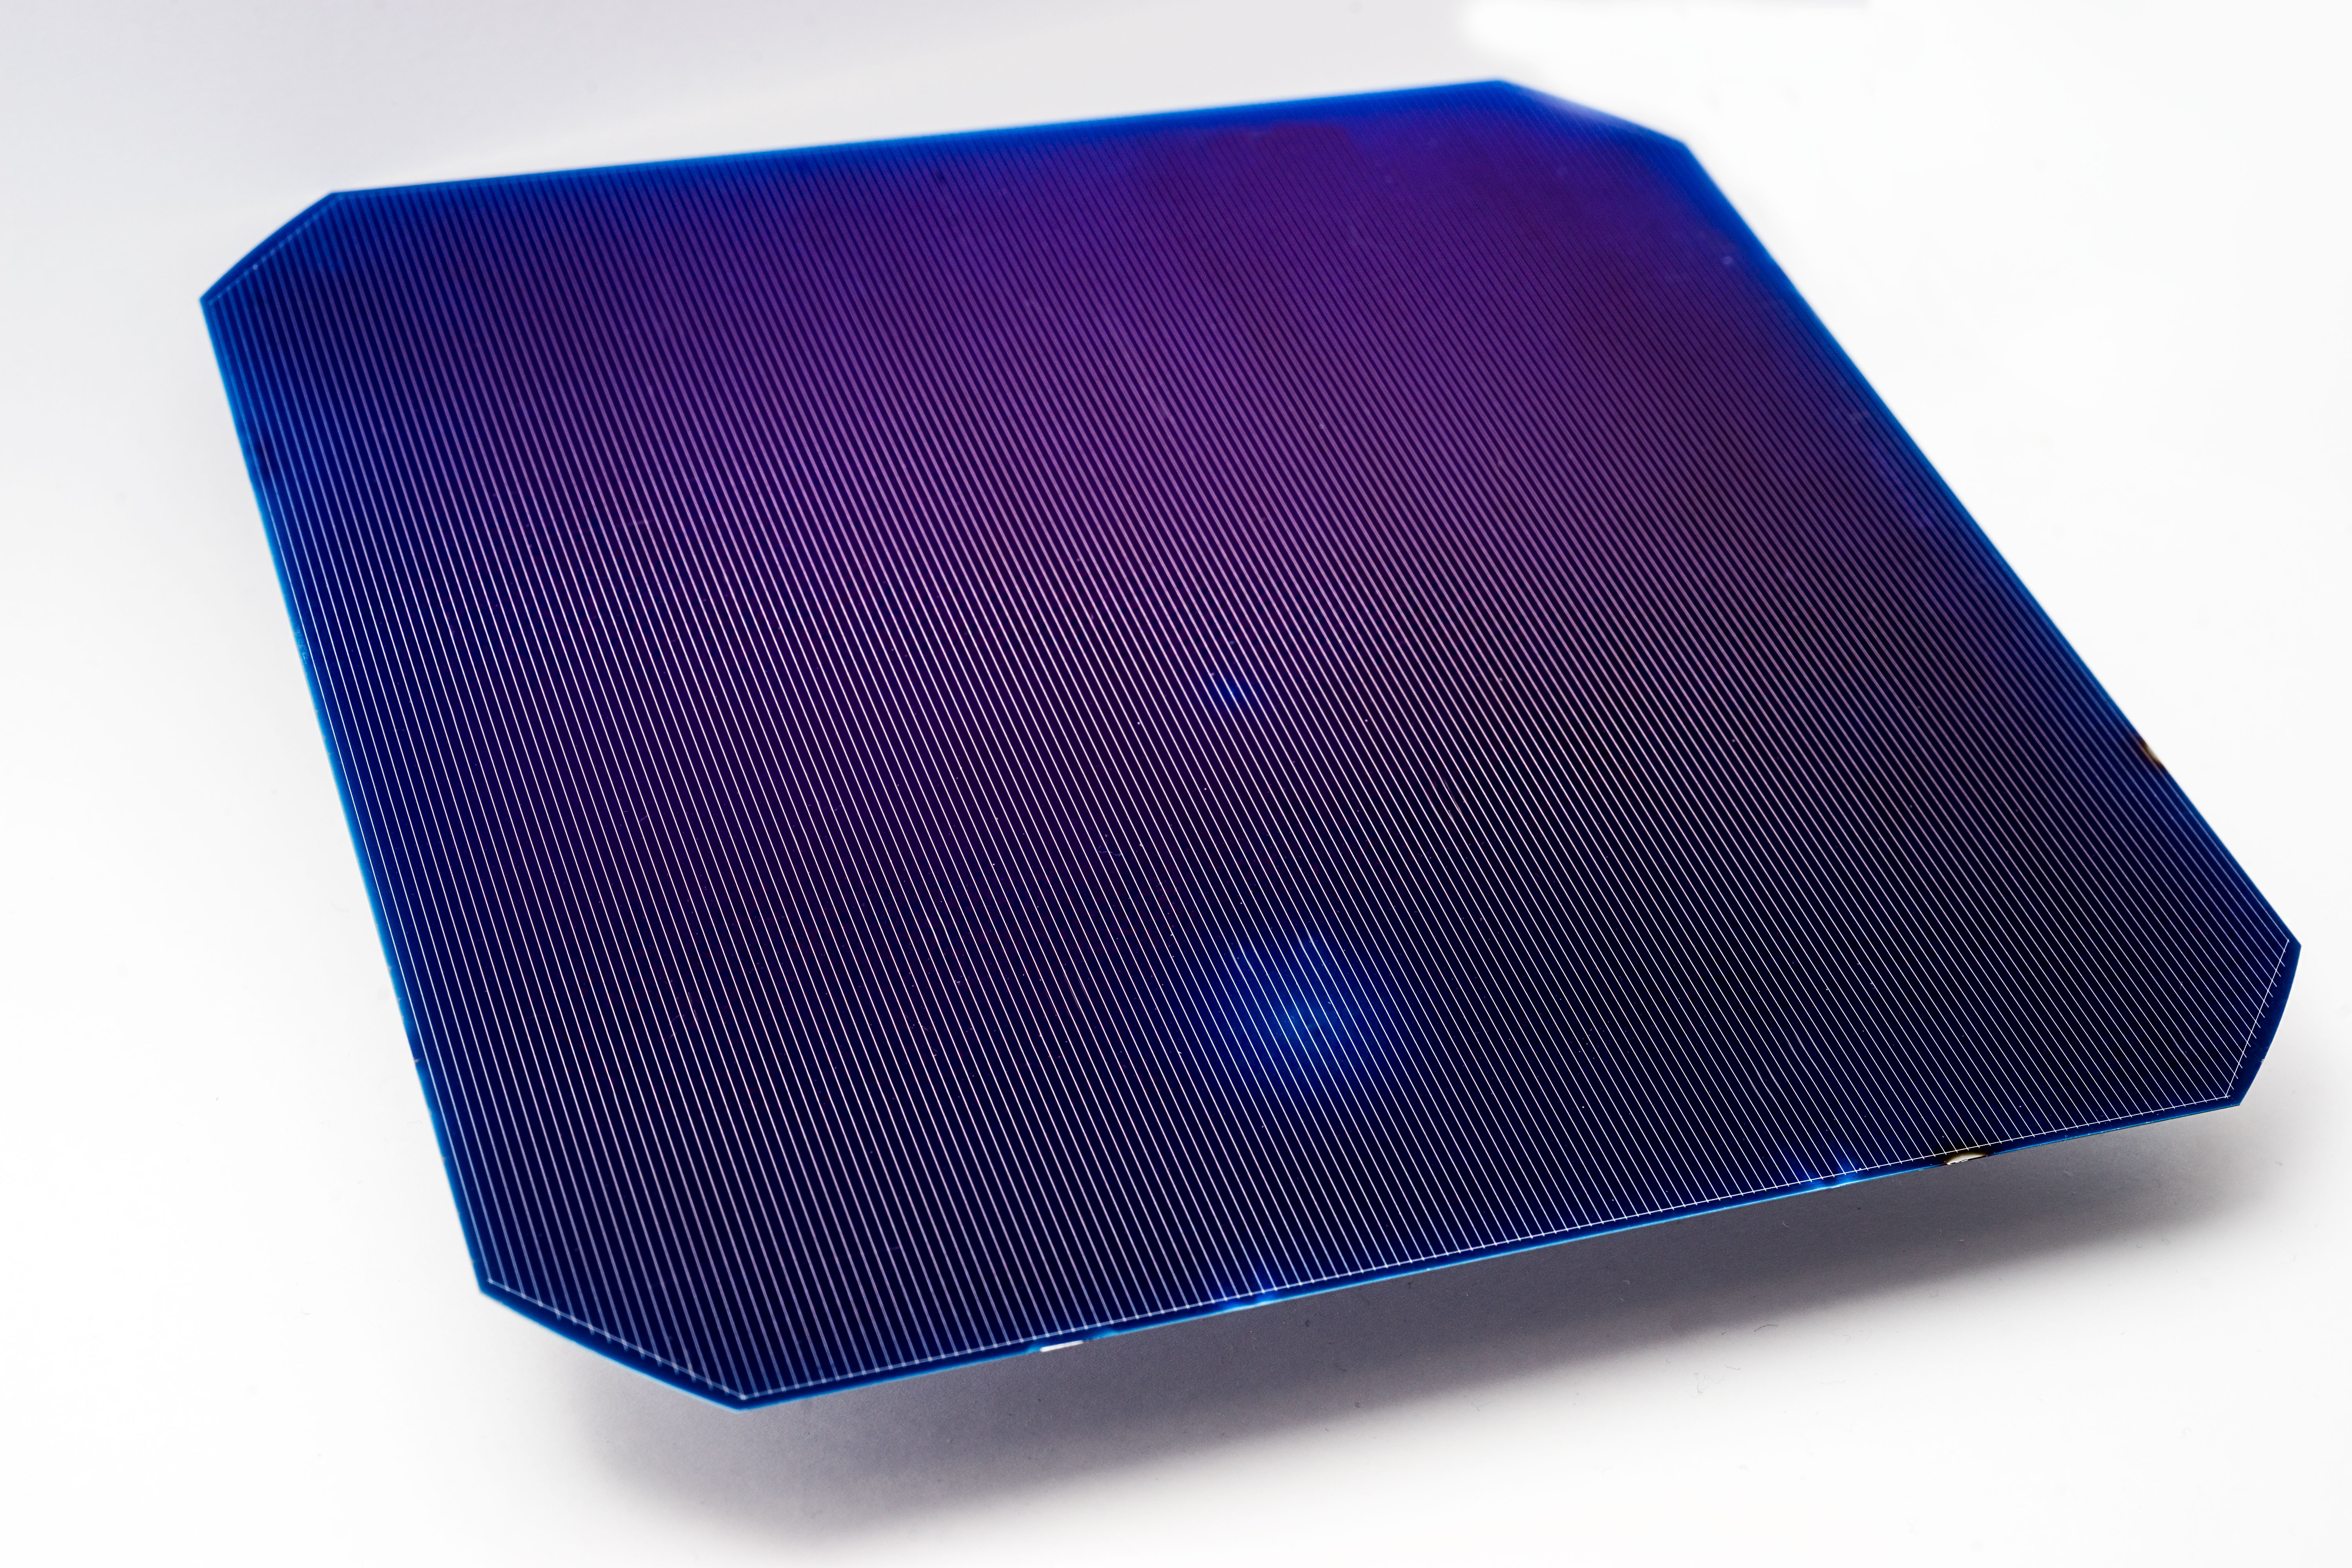
bifacial n-PERT (BiPERT) solar cell
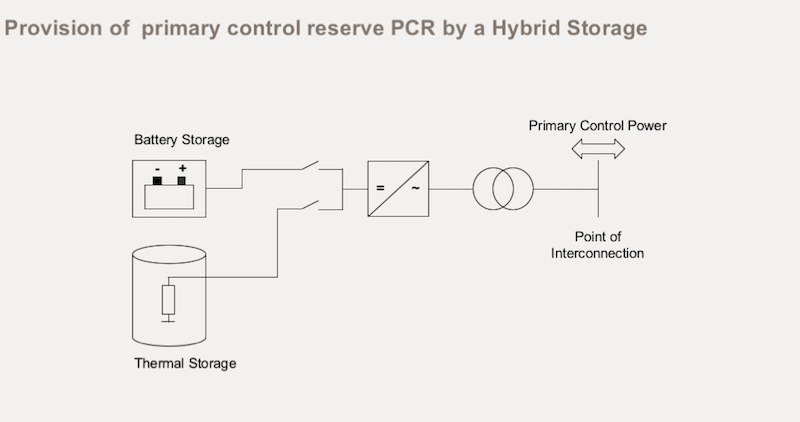
Hybrid Energy Storage System

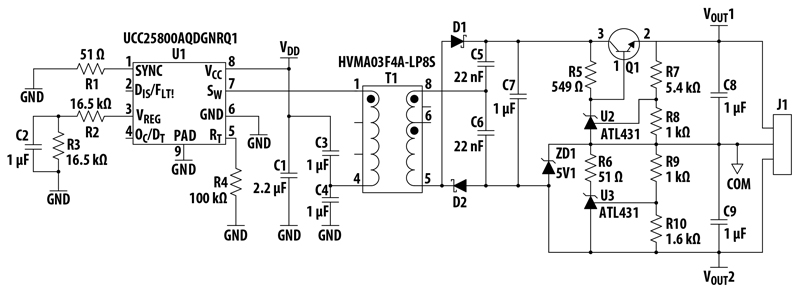
Intersil 12-cell lithium-ion (Li-ion) battery pack monitor
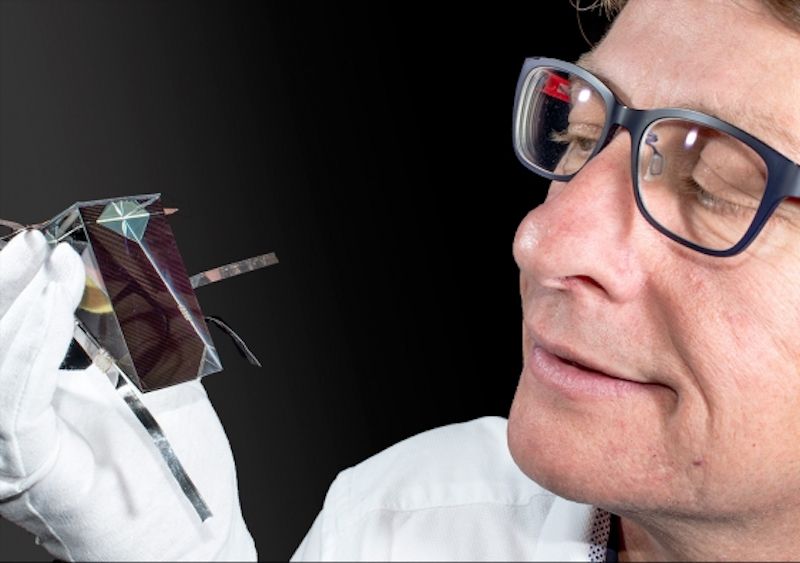
Dr. Mark Keevers, University of New South Wales

Larry Spaziani, GaN Systems

Kevin Parmenter, PSD Contributor

Regional grids like the one proposed to share all kinds of power already thrive in the Midwest, New England and in the mid-Atlantic
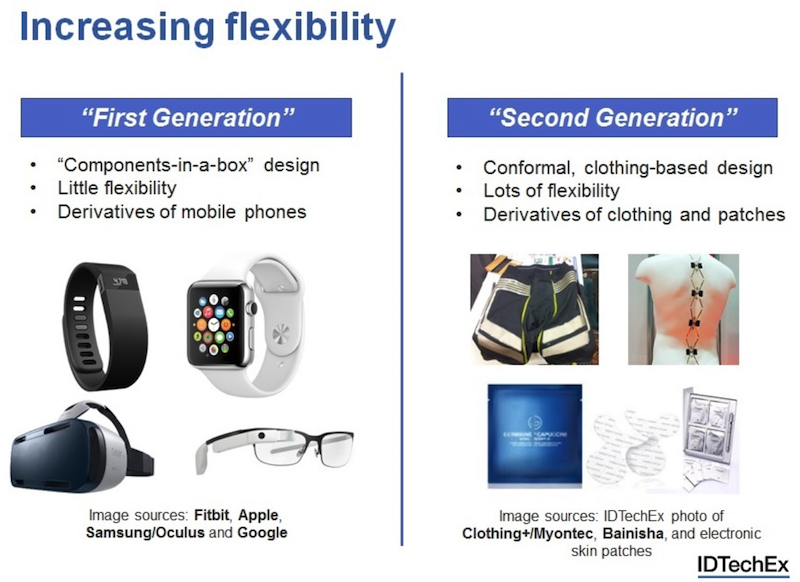
E-textiles are on the cusp of rapid growth

One of OpenHydro's turbines is tested before being lowered into the ocean