Renewable Energy
December 2021
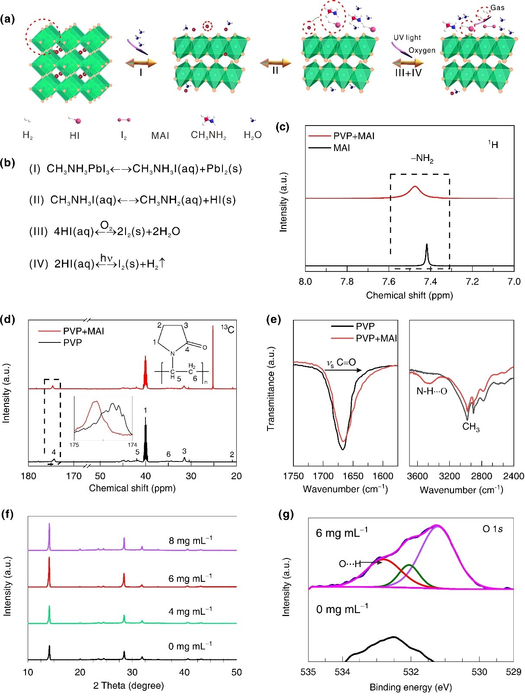
Fig. 1. Degradation of the perovskite material with moisture.
A team led by Prof. HU Linhua at the Hefei Institutes of Physical Science of the Chinese Academy of Sciences (CAS) has recently developed a type of self-healing perovskite solar cell by functional combination of polyvinylpyrrolidone (PVP). Related results were published in Journal of Energy Chemistry.
These solar cel
. . . Learn More
Date:
12/31/2021
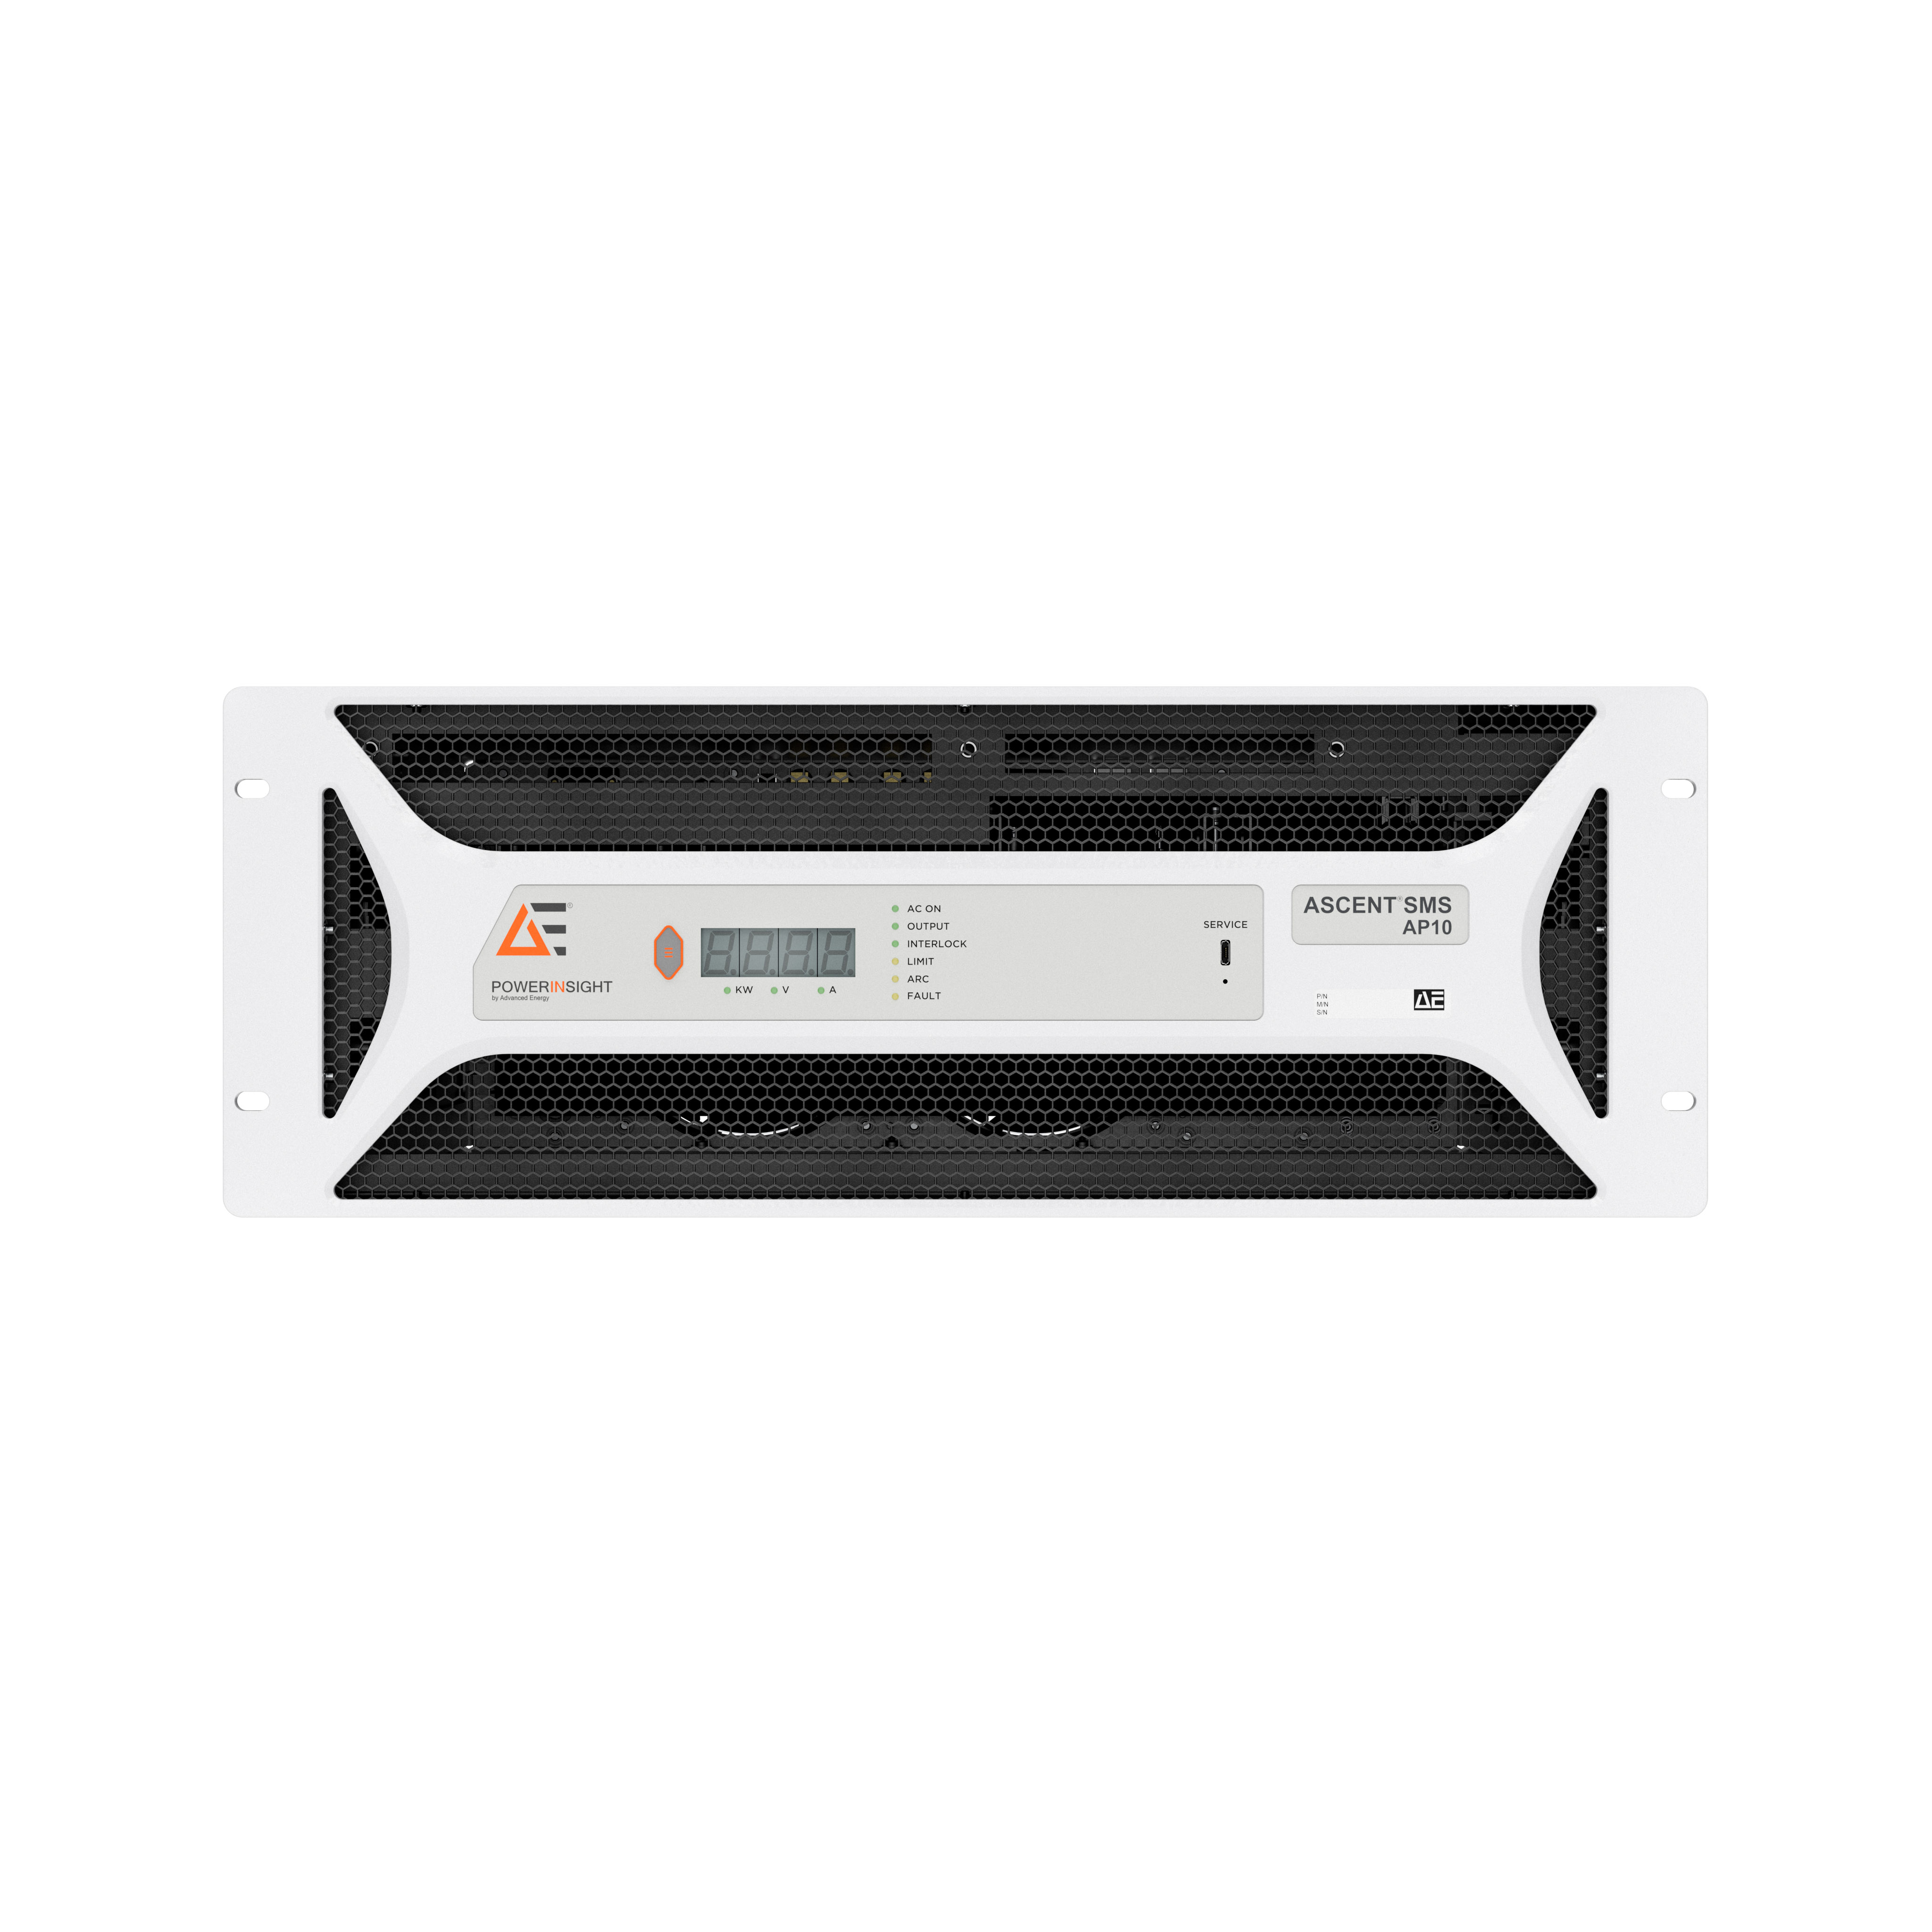
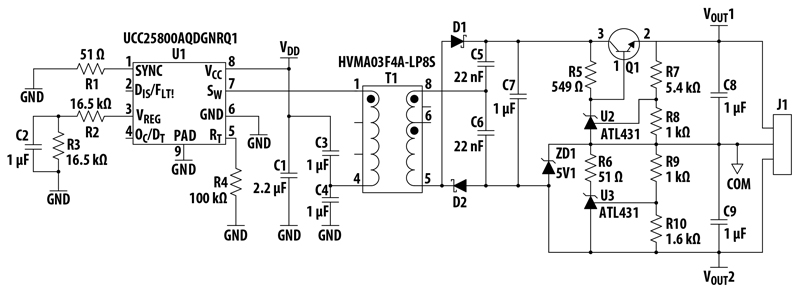
Advanced Energy has expanded its family of plasma power generators with a 10 kW pulsed DC power supply that combines industry-leading power and control capabilities with PowerInsight by Advanced Energy embedded process optimization software. With patented pulsing technology, the Ascent SMS AP (Advanced Pu
. . . Learn More
Date:
12/07/2021
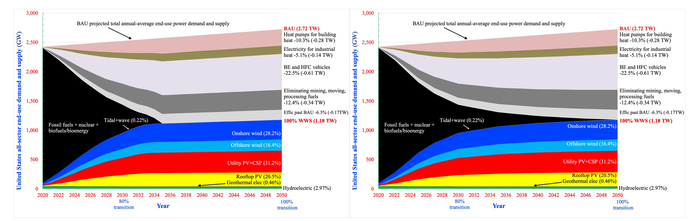
Graphs showing timeline of energy sources for meeting all U.S. energy needs with wind, water and solar (WWS) power sources. The graph on left shows mix for 80% WWS by 2030 and 100% by 2035. The graph on right shows mix for is 80% by 2030 and 100% by 2050. The 2050 end points in both cases are cases examined in the study.
For some, visions of a future powered by clean, renewable energy are clouded by fears of blackouts driven by intermittent electricity supplies. Those fears are misplaced, according to a new Stanford University study that analyzes grid stability under multiple scenarios in which wind, water and solar en
. . . Learn More
Date:
12/07/2021

Ben Johnston, the COO at Kapitus
A $1.2 trillion dollar infrastructure bill just passed, with President Biden calling it "a once-in-generation bipartisan infrastructure bill that will create millions of jobs…." And today, we’ll be discussing the bill’s impact on small businesses and renewable energy in general with Kapitus.
Date:
12/06/2021

In 2020, renewable generating capacity grew by 261 gigawatt hours, up 10.3 %, according to a new study by the International Renewable Energy Agency (IRENA), Solar energy continues to lead this expansion with growth of 127 GW, up 22 %. BUTTING plays its part with its products in this development and currently pr
. . . Learn More
Date:
12/02/2021

It has been a challenging and often frustrating year for us all and hopefully next year will give us a fresh start, or at least put us on the path to one. The chip shortage has persisted longer than most analysts thought and it may now be the middle of next year before the fabs have caught up with demand. The sh
. . . Learn More
Date:
12/01/2021
Archive