
Paul Hart, Senior Vice President and General Manager – Radio Frequency, at NXP Semiconductors

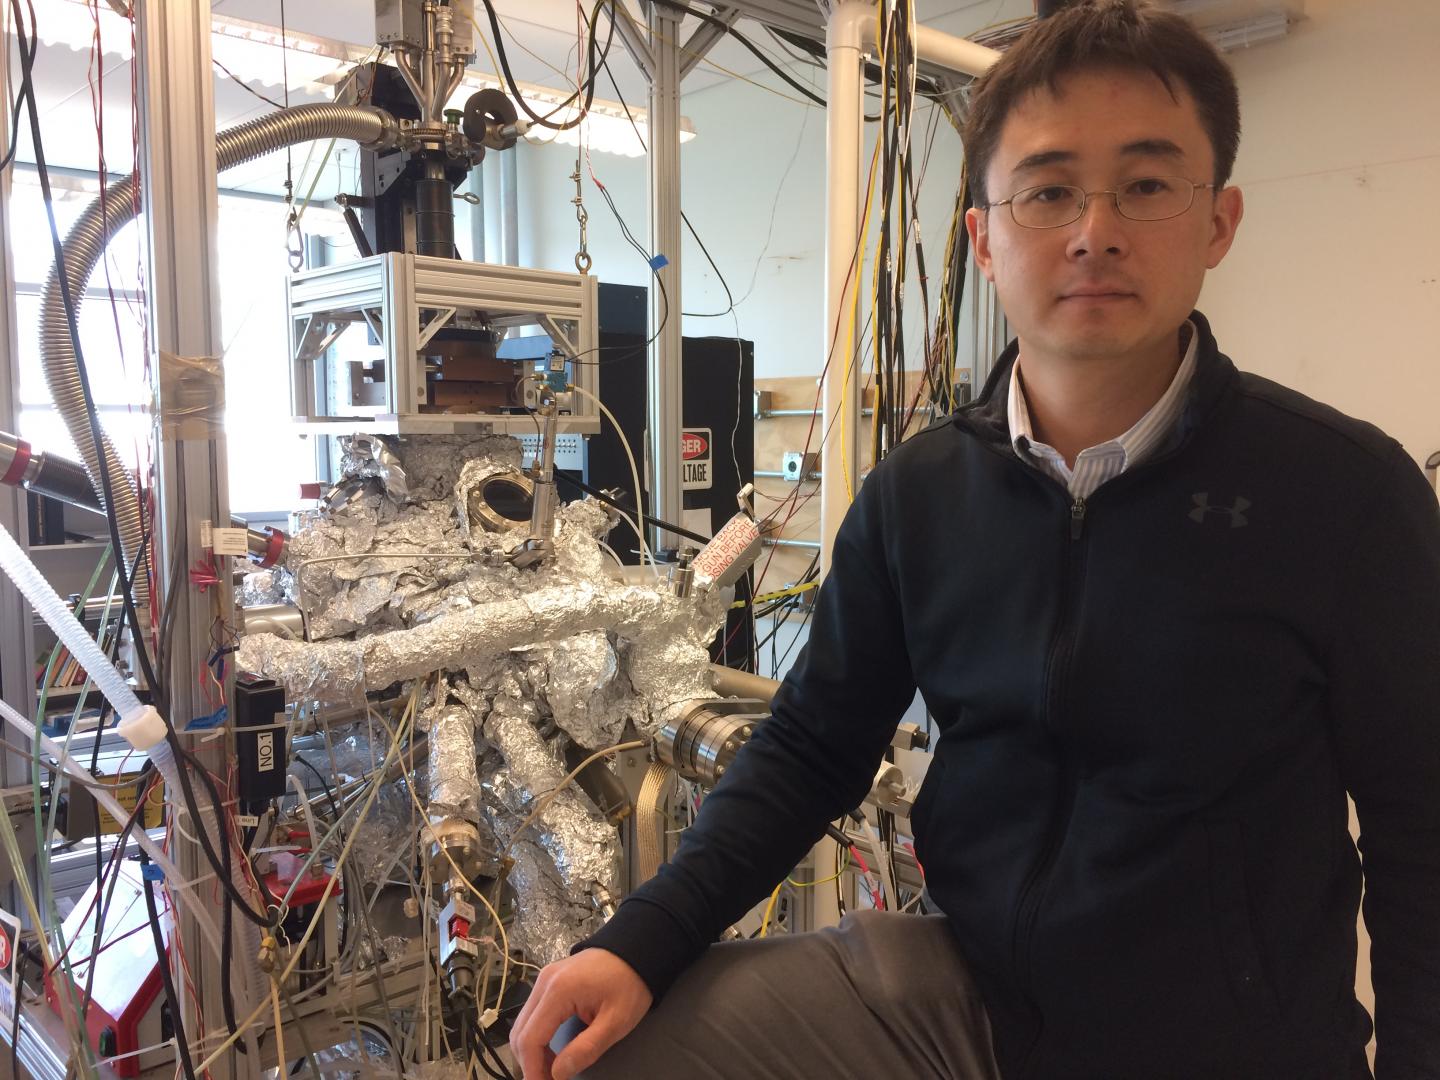
Peng Wei is a condensed-matter physicist at UC Riverside, studying quantum states of electrons in new materials.
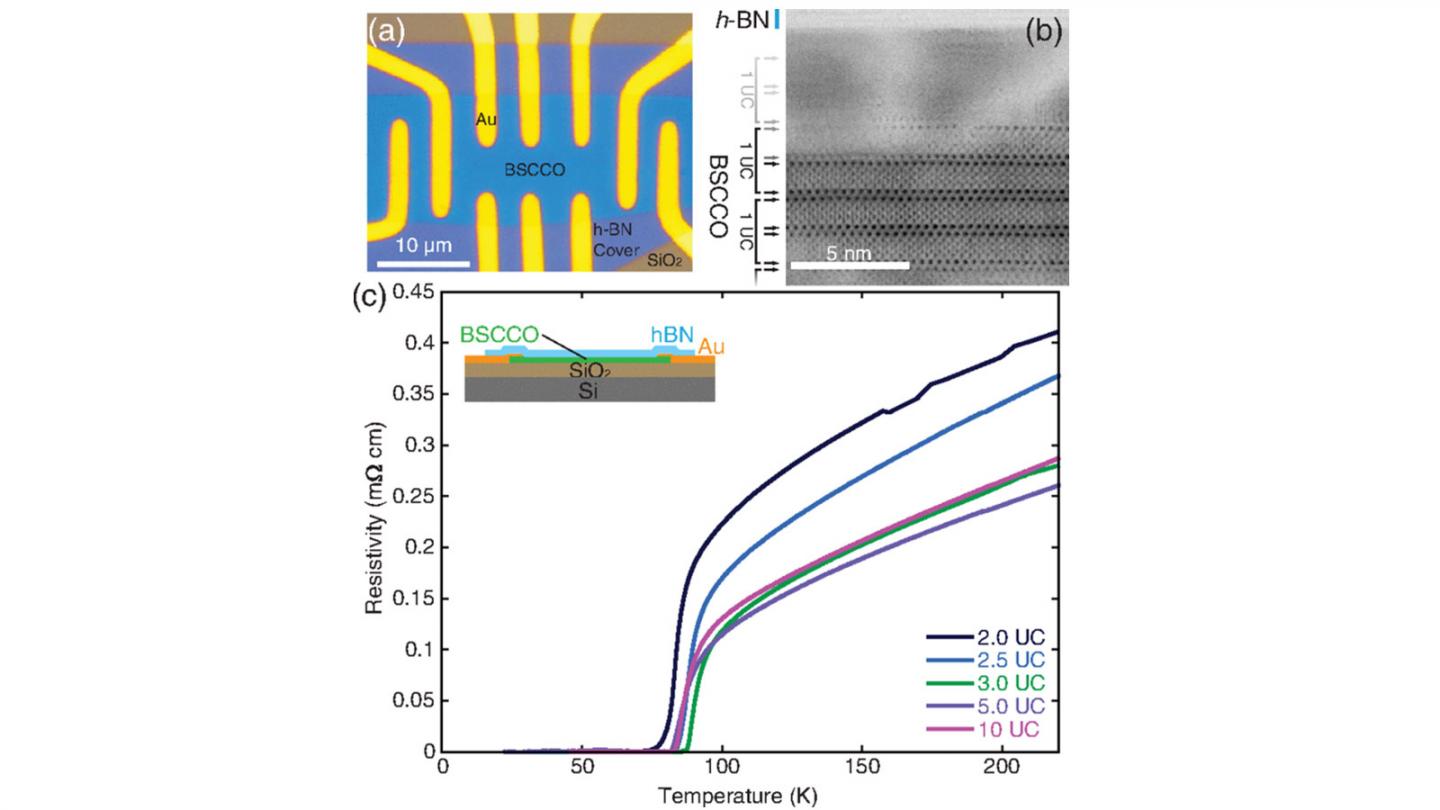
Graphic showing van der Waals BSCCO device. (a) Optical image of Hall bar device, (b) Cross-sectional view of a typical device in scanning TEM. Columns of atoms are visible as dark spots; black arrows point to bismuth oxide layers (darkest spots), while gray arrows show their extrapolated positions. (c) Resistivity as a function of temperature for devices of a different thickness.
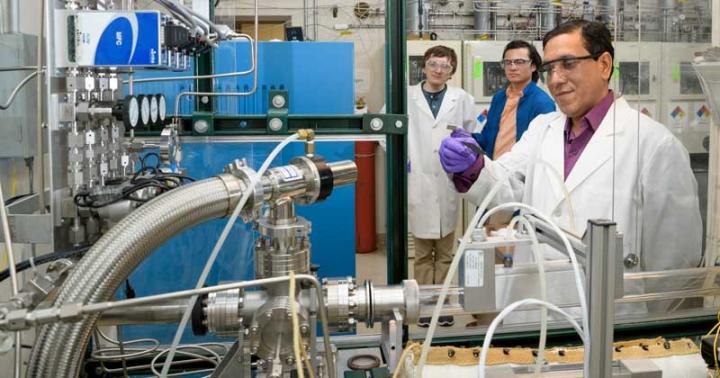
Ujjwal Das, an associate scientist at the University of Delaware's Institute of Energy Conversion, examines a silicon wafer after a thin layer of sulfur - less than 5 nanometers thick - was deposited on the surface. In the background, doctoral students Robert Theisen and Isaac Lam watch a silicon wafer emerge from the atmospheric pressure vapor treatment reactor, where it was treated with hydrogen sulfide and hydrogen selenide gases. The reactor was developed at IEC.
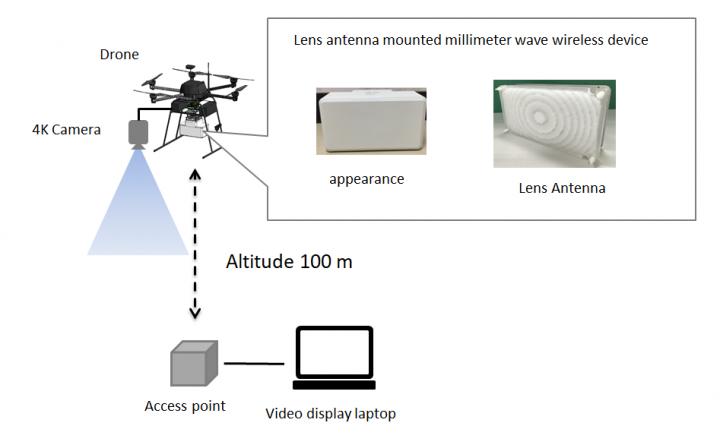
SECOM and Tokyo Tech jointly developed a millimeter wave wireless communication system that enables long distance communication, and succeeded in transmitting 4K uncompressed video in real time from a drone.


.png)


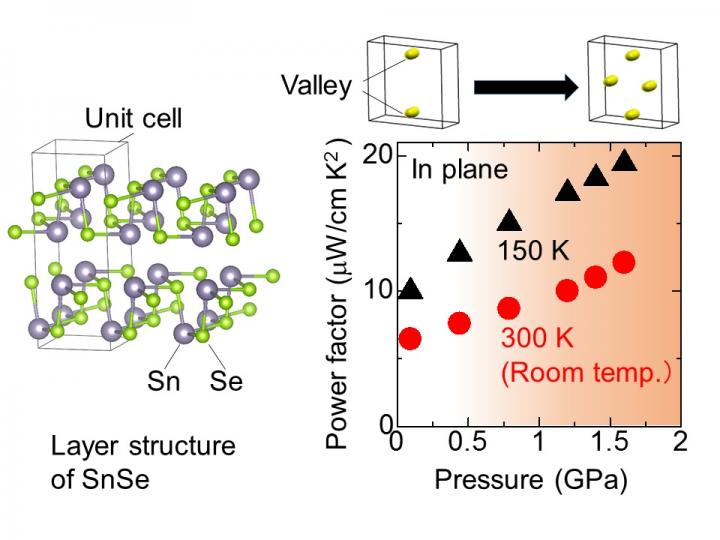
(Left) Schematic of the layered crystal structure of SnSe. (Right) Pressure dependence of thermoelectric power factor at 150 K and 300 K for SnSe. Inset shows the schematic illustration of the corresponding change in valley topology in SnSe.


Jiming Bao, associate professor of electrical and computer engineering at the University of Houston, led an international group of researchers investigating how a two-dimensional perovskite composed of cesium, lead and bromine was able to emit a strong green light.


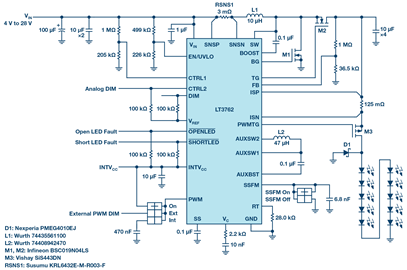
A 32 V, 2 A LT3762 boost LED driver.

UnitedSiC's President and CEO, Chris Dries


Samarium sulfide doped with various rare earth elements shrinks as the temperature increases from about minus 175°C to about 40-60°C. Shown here is the relative linear shrinkage compared to the length at about 120°C. For the Cerium (Ce) dopant, the percentage volume decrease is about 2.6%. These samples were produced by an industrially scalable process, paving the way for practical applications of this class of sulfides as thermal-expansion compensators.
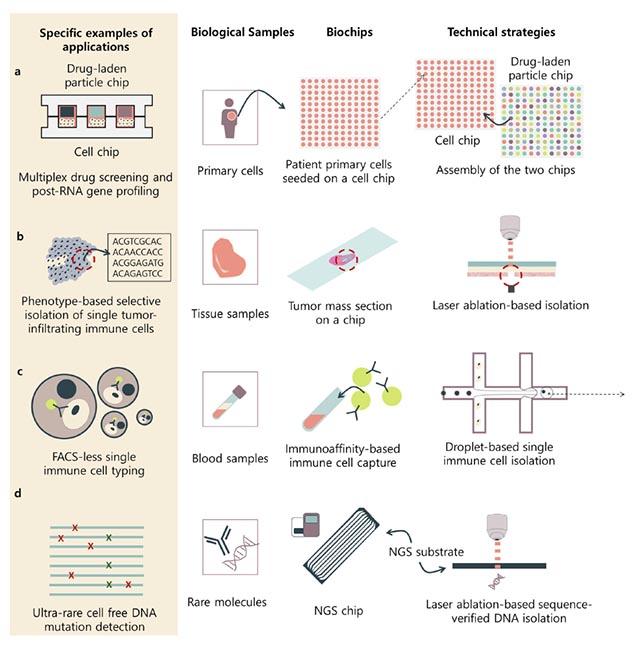
Biochips are driving next-generation DNA sequencing technologies, and this powerful combination is capable of solving unique and important biological problems, such as single-cell, rare-cell or rare-molecule analysis, which next-generation sequencing can't do on its own. In APL Bioengineering, researchers from Seoul National University explore the role advancements in biochip technology are playing in driving groundbreaking scientific discoveries and breakthroughs in medicine via next-generation sequencing, aka high-throughput sequencing. This image shows perspectives on potential biochips used for next generation sequencing for promising applications in biotechnology.

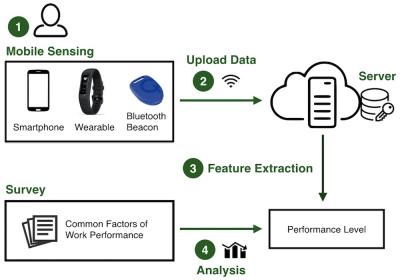
Smartphones, fitness bracelets and a custom app form a mobile-sensing system that judges employee performance.
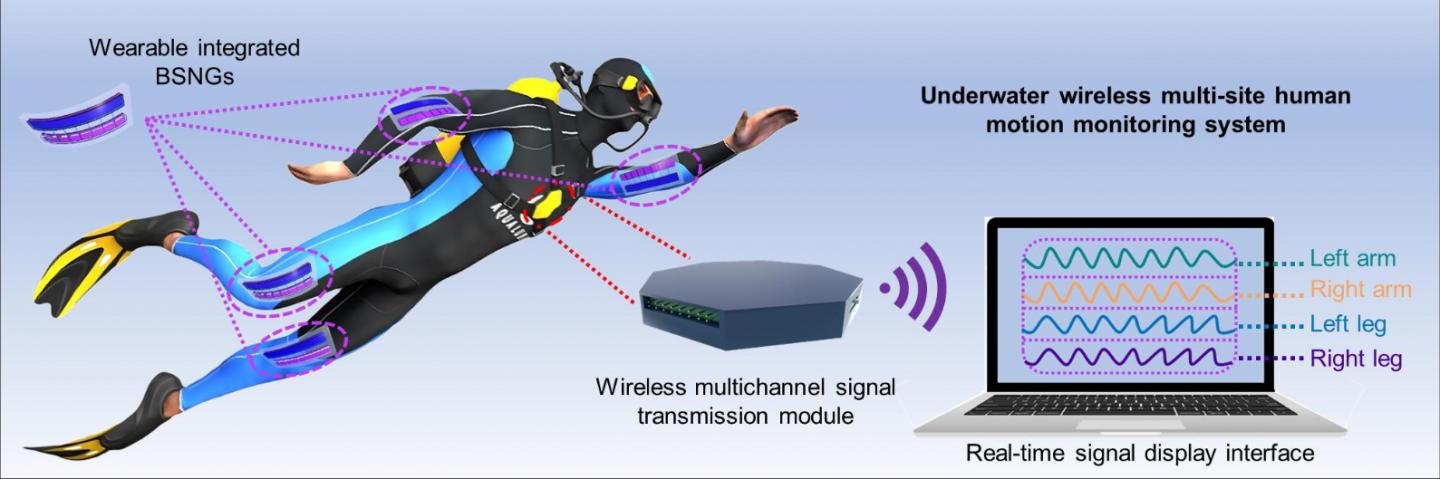
Underwater wireless multi-site human motion monitoring system based on BSNG.
.jpg)

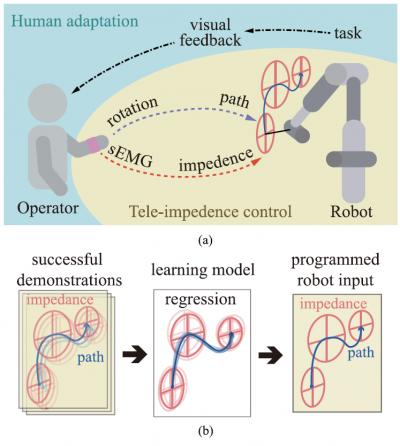
This research outcome shows that robots can be intuitively taught to be flexible by humans, as it was not accomplished through numerical calculation or programming of the robot's movements.

Laser pulses.
PNNL's ShAPE process combined with a unique aluminum alloy produced high-strength, high-ductility rods in one single process.

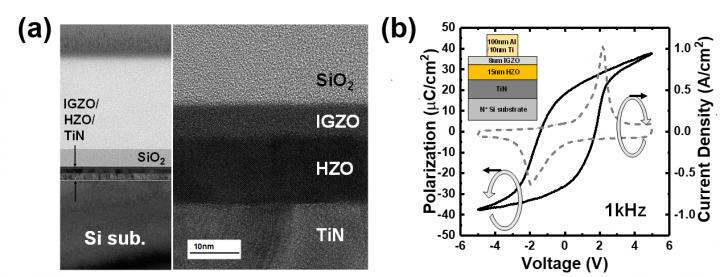
(a) Cross-sectional TEM image of a TiN/HfZrO2/IGZO capacitor. Each layer was uniformly formed. HfZrO2 layer is uniformly crystallized having ferroelectric phase. (b) Measured polarization charge versus voltage of a TiN/HfZrO2/IGZO capacitor. Clear ferroelectricity was confirmed.

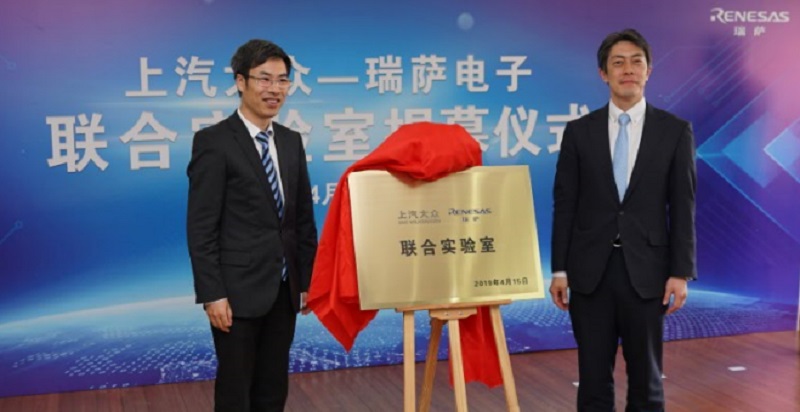
Josh Broline from Renesas
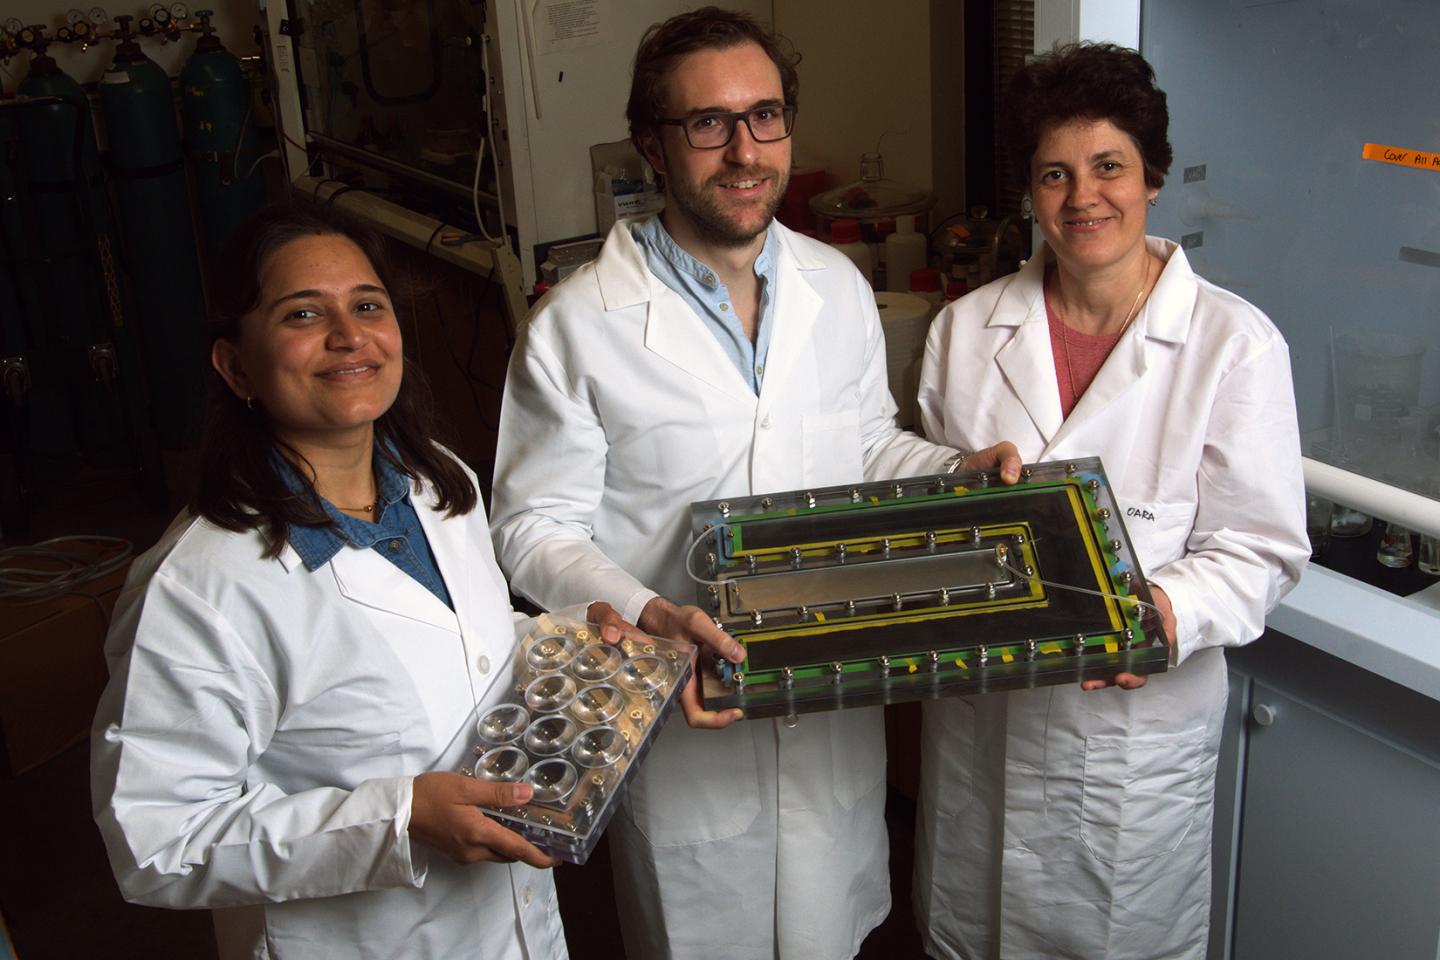
Rice University researchers (from left) Pratiksha Dongare, Alessandro Alabastri and Oara Neumann showed that Rice's 'nanophotonics-enabled solar membrane distillation' (NESMD) system was more efficient when the size of the device was scaled up and light was concentrated in 'hot spots.'
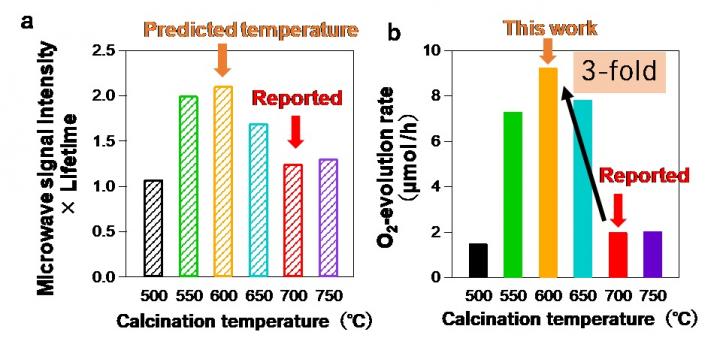
(a) Product of microwave photoconductivity intensity and its lifetime of oxyhalide photocatalyt 2 vs calcination temperature. The microwave measurements suggest the optimal temperature of 600 ? that is 100 ? lower than the reported one. (b) O2-evolution rate of oxyhalide photocatalyt 2 prepared by different calcination temperature.
.jpg)

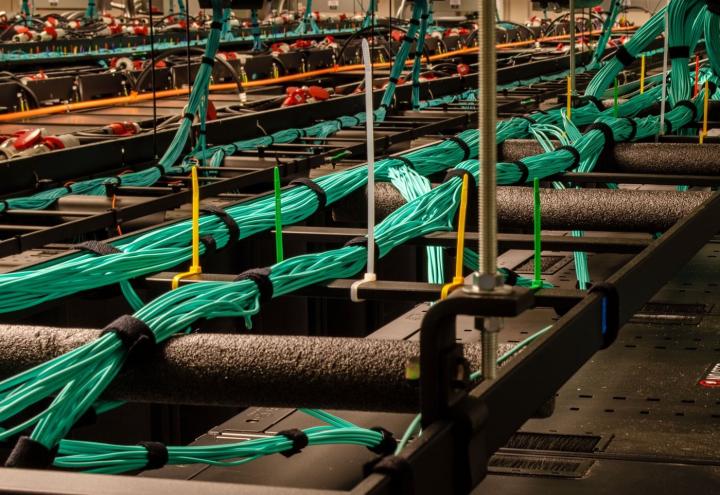
Over 50 miles of network interconnect cabling enable Frontera's compute nodes to communicate to each other and to the network servers.
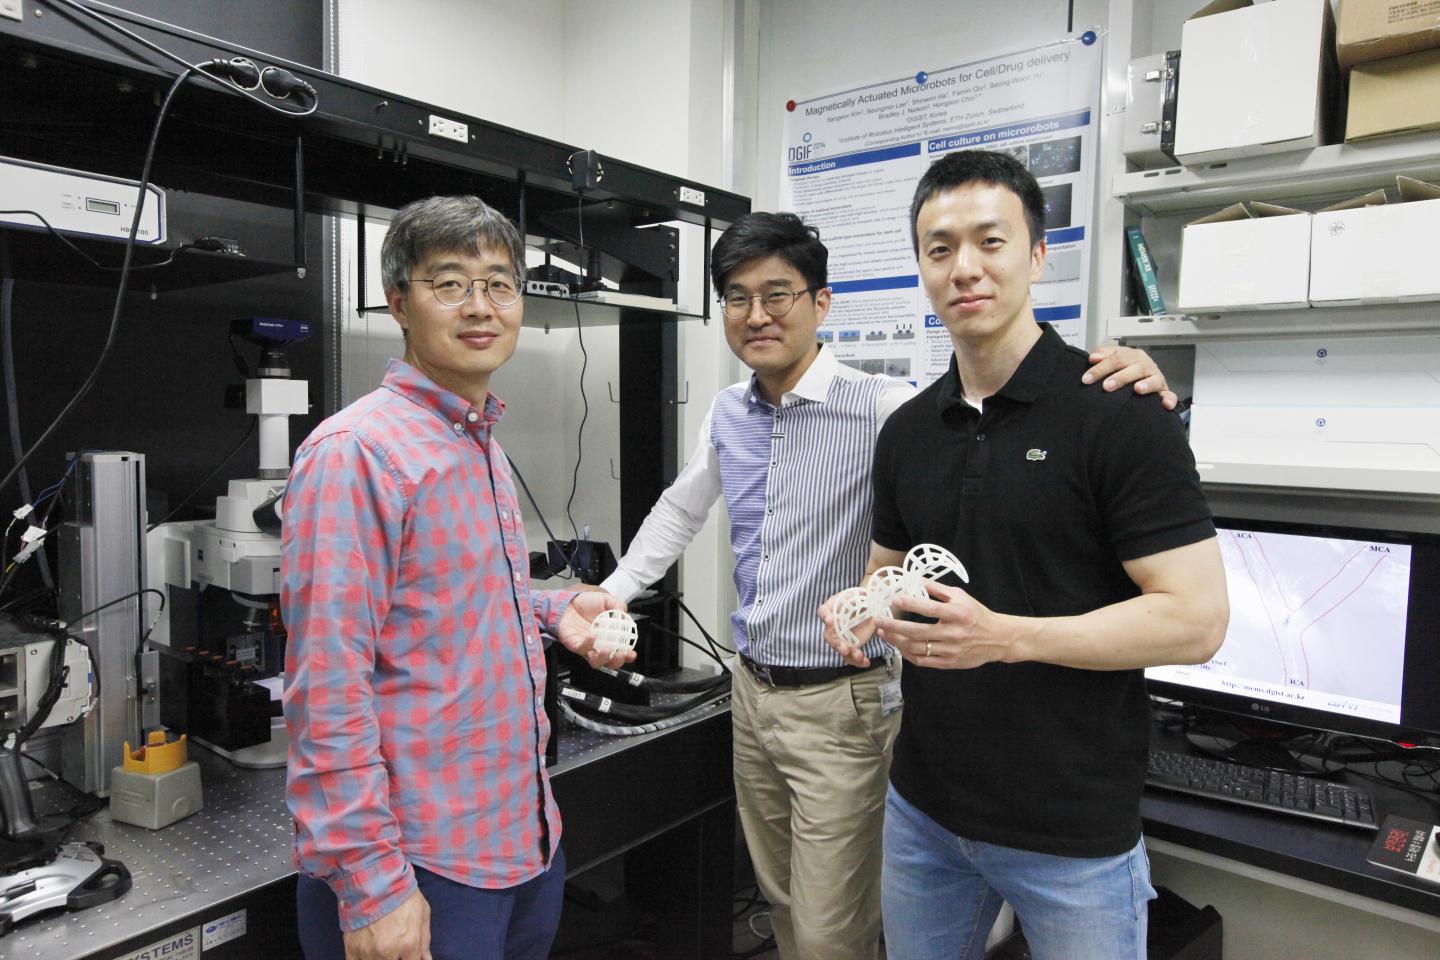
Professor Hongsoo Choi in the DGIST Department of Robotics Engineering (left), first author and Ph.D. student Seong Woong Jeon (right), senior Researcher Jin-young Kim at DGIST-ETH Microrobot Research Center (middle)

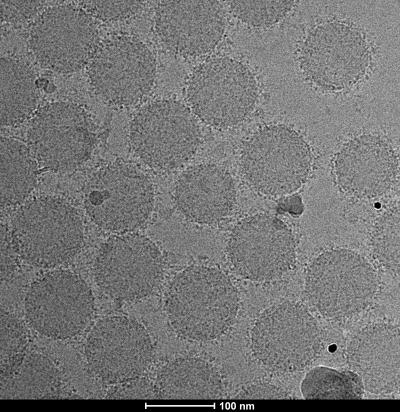
Transmission electron microscopy image showing the formation of biomolecular corona around the surface of nanoparticles.

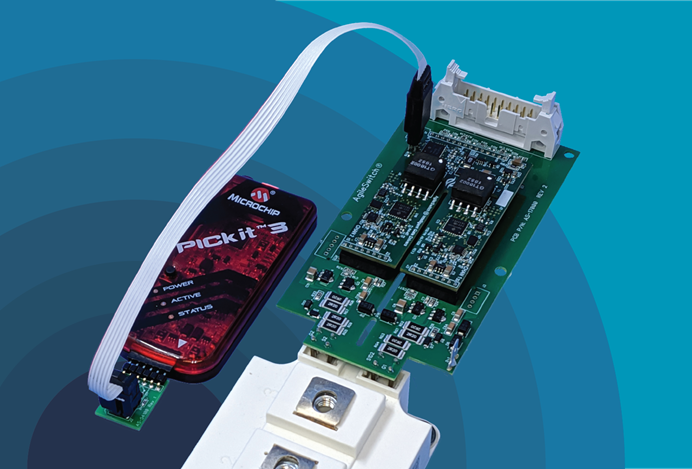
Click image to enlarge
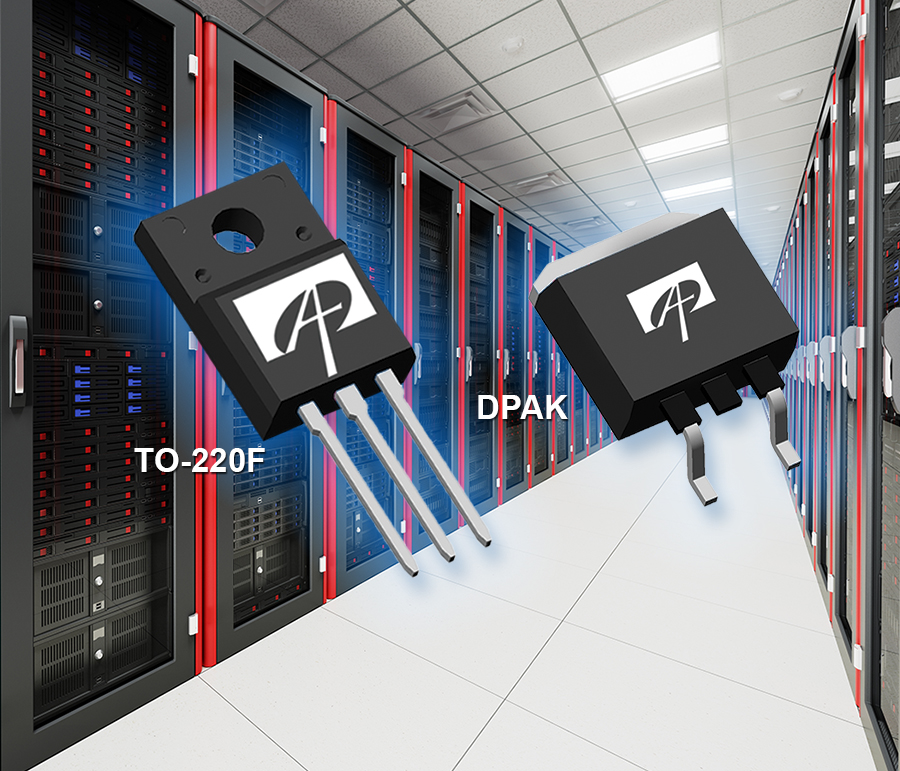
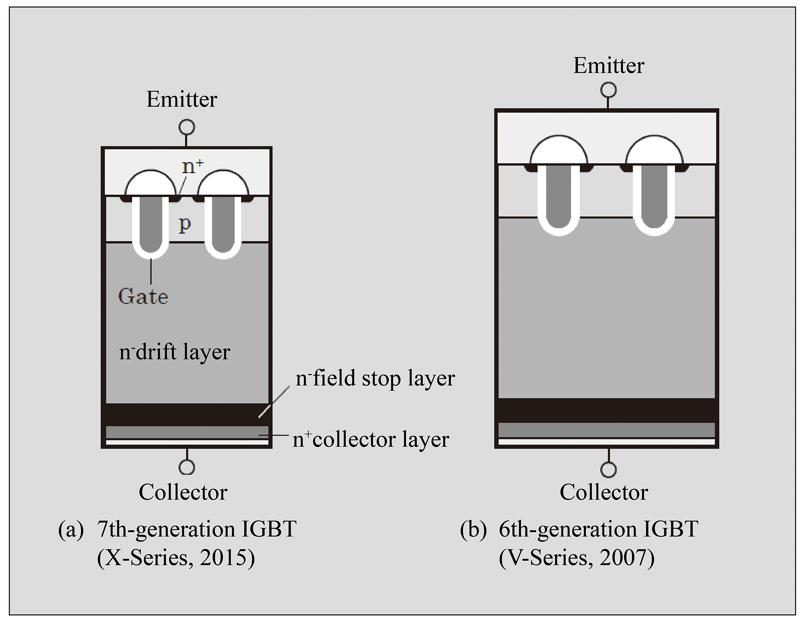
Figure 1: IGBT cross sectional structure
Seoul Semiconductor’s Mark McClear


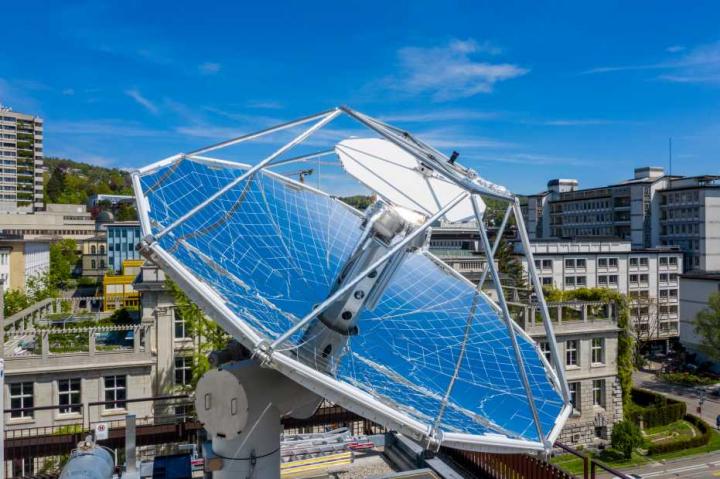
The research plant is located on the roof of the ETH building on Sonneggstrasse.

Dr. Juanita Kurtin, Director of Materials Research at OSRAM Opto Semiconductors
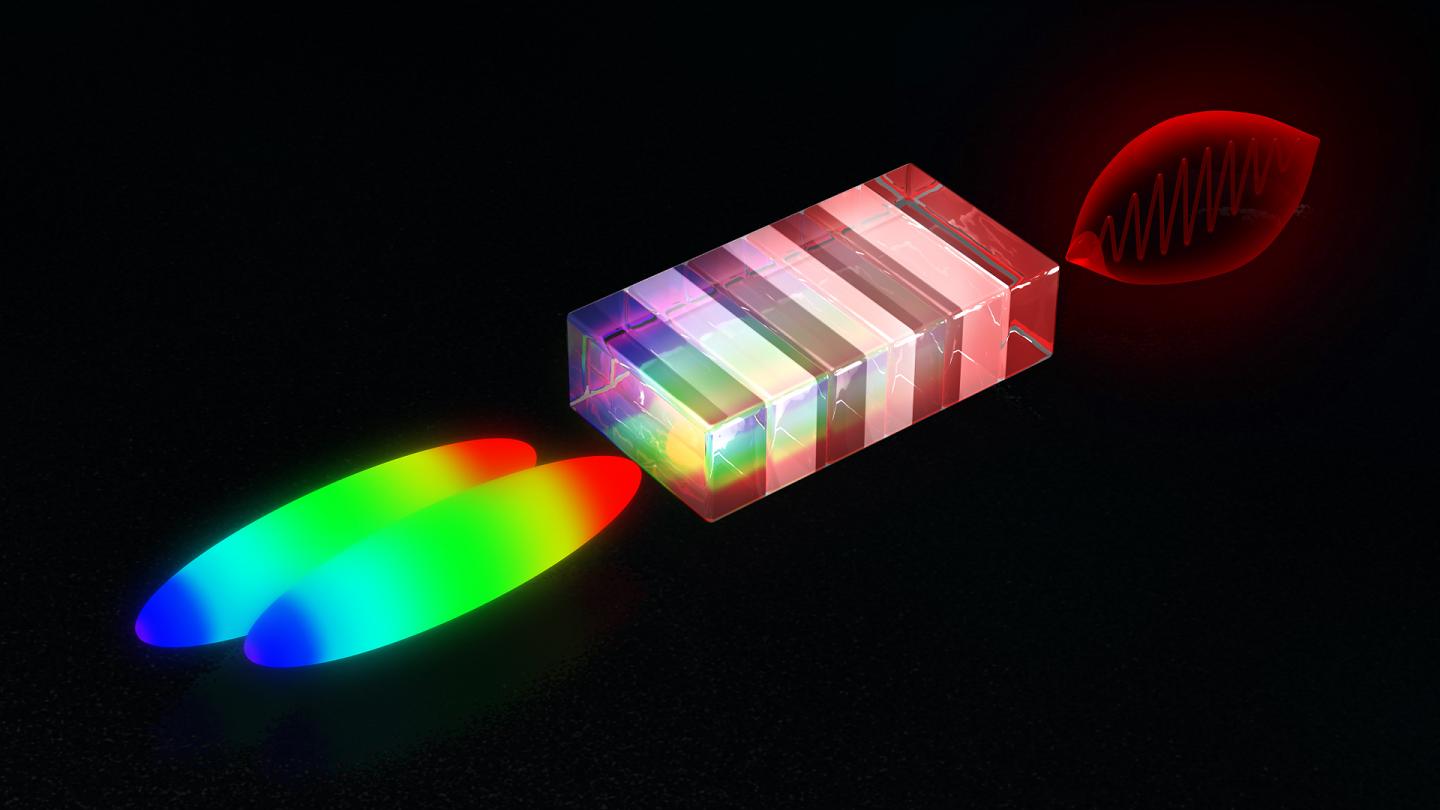
From the color difference of two slightly delayed laser flashes (left) a non-linear crystal generates an energetic terahertz pulse (right).